
September 16, 2026
The No-Rise Surprise
Why Additional Conveyance Area Doesn’t Always Lower Water Surface
Kleinschmidt Associates
Copyright © 2026
Why Additional Conveyance Area Doesn’t Always Lower Water Surface
One of my favorite hydraulic paradoxes is that sometimes making a hydraulic opening wider causes the water surface to go up.
Not upstream. Not across the reach. Right at the wider section itself.
If you’ve ever run a no-rise analysis for a new bridge or culvert, you’ve probably seen it. You widen a bridge opening, replace a culvert with a larger one, or remove an obstruction. The upstream water surface drops, exactly as expected. But then you look at the cross section or cells at the structure and notice a small increase in water surface elevation.
“Wait…what?”
“We just increased conveyance through my bridge opening. How could the water level be higher? And now I have this rise to deal with?!?!”
“It must be a bug.” “I must have made an error somewhere.” Actually…
In subcritical flow, narrowing a channel causes the water surface at the constriction to drop rather than rise. And in supercritical flow the water surface will rise.
Most engineers learn this in hydraulics class. Many promptly forget it. Then years later HEC-RAS reminds them in the middle of a no-rise analysis!
The Intuitive Answer is Wrong
Let’s start with the intuition. Imagine a river carrying 5,000 cfs. Now make the channel narrower in one spot. Could be from a bridge, or maybe a bank stabilization project.
What happens?
It’s not unreasonable to think the same amount of water has to fit through a narrower width, so the water level must rise.
That sounds perfectly reasonable.
The problem is that the explanation focuses entirely on space and ignores energy. Flowing water doesn’t care nearly as much about available space as we think it does. Water cares more about energy.
The Missing Piece: Velocity Has to Come from Somewhere
We all know the equation discharge equals velocity times flow area:
Q=VA
If discharge stays the same and area decreases, velocity must increase. No controversy there. That’s continuity. The question is what happens next.
Increasing velocity requires energy. Where does that energy come from?
In open channel flow, it comes from the depth. The depth represents potential energy in an open channel. The velocity (more specifically velocity head) represents kinetic energy.
The constriction leads to a conversion of potential energy into kinetic energy. The result is that the water accelerates and the depth decreases. The water surface drops. This is the exact opposite of what most people expect the first time they encounter it. A constriction isn’t acting like a dam. It’s acting like a nozzle.
The Specific Energy Curve Tells the Story
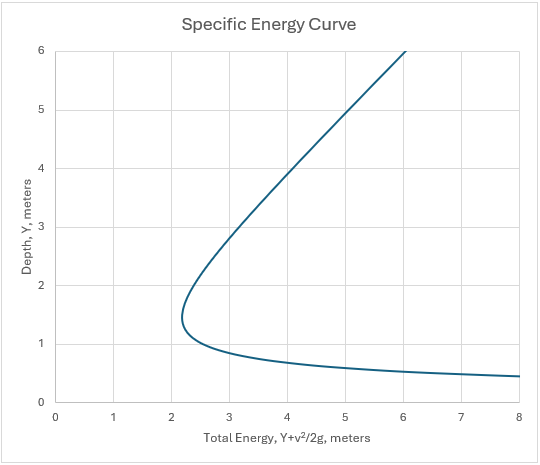
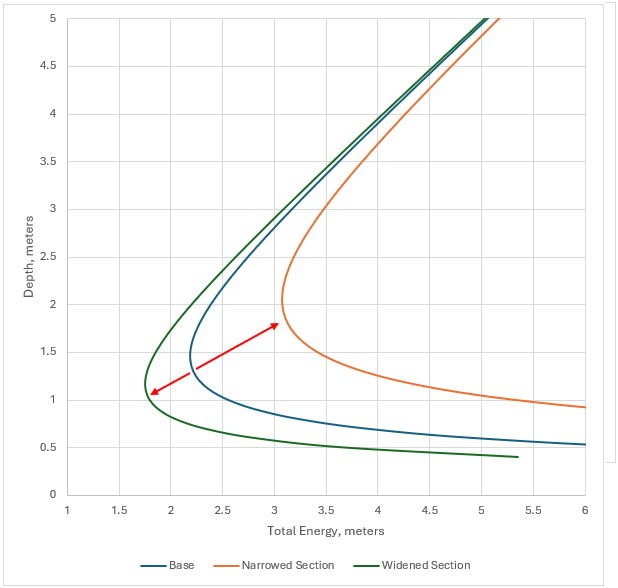
This behavior is beautifully illustrated by the specific energy curve shown in Figure 1.
You cannot discuss the specific energy curve without first introducing the total energy equation for open-channel flow:
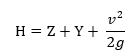
In this equation, H represents the total energy per unit weight of water and is expressed in units of length. Representing energy in this way is convenient because it provides a tangible measure that can be visualized directly in feet or meters. The term Z is the elevation of the channel bottom relative to a selected vertical datum, while Y is the flow depth measured above the channel bottom. The final term, v²/2g, is the velocity head and represents the kinetic energy of the flow.
The concept of specific energy simply refers to the energy measured specifically from the channel bottom. Therefore, by removing the bed elevation term, Z, from the total energy equation, the result is the specific energy equation:
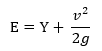
The specific energy, E, is thus equal to the flow depth plus the velocity head. This relationship forms the foundation of the specific energy curve, which describes how energy varies with flow depth for a given discharge.
For a given discharge, every point on the curve represents a balance between:
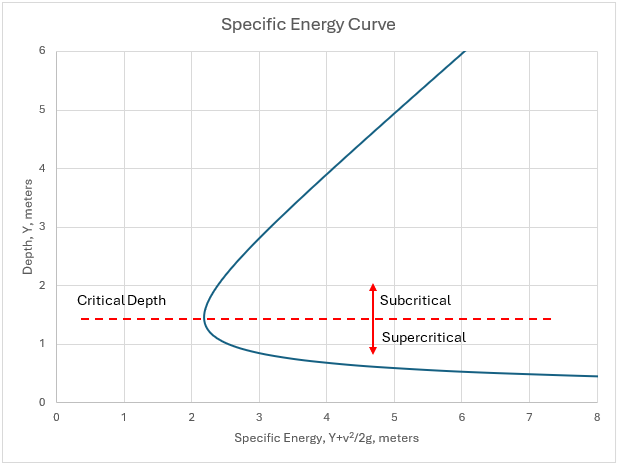
The minimum energy point on the curve is the critical depth (Figure 2). Water flowing with depths above this level is subcritical and below is supercritical. Subcritical flow is dominated by depth energy, while supercritical flow is dominated by velocity energy. Besides critical depth, notice that for any given amount of specific energy, there are two alternative depths, one subcritical and one supercritical.
Whenever flow passes through a constriction, the specific energy curve shifts up and to the right for the constricted section. If the section widens, the specific energy curve shifts down and to the left. In Figure 3, the blue line in the middle represents the specific energy curve for a 10-meter-wide rectangular channel with a discharge of 100 cubic meters per second (cms). The orange line to the right represents a 6-meter-wide section (constriction) and the green line to the left represents a 14-meter-wide section (expanded).
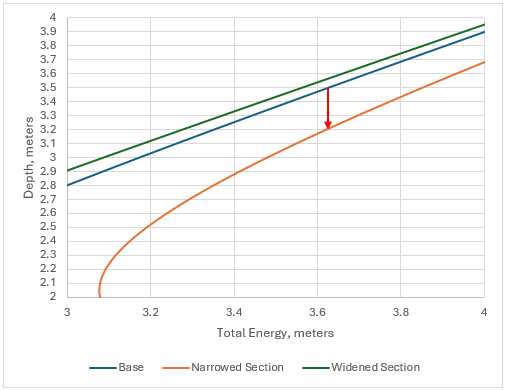
Let’s say you have a ten-meter-wide rectangular channel, flowing at 100 cms, and the channel slope was shallow such that it produced a subcritical depth of 3.5 meters. Then you narrow a brief section of the channel to 6 meters wide. Assuming the same energy (i.e. no total energy loss through the constriction) you would have a slight decrease in depth at that section to 3.2 meters as you shift from the blue curve (10 meters wide) to the orange curve (6 meters wide), as demonstrated in a zoomed in view of the specific energy curves (Figure 4).
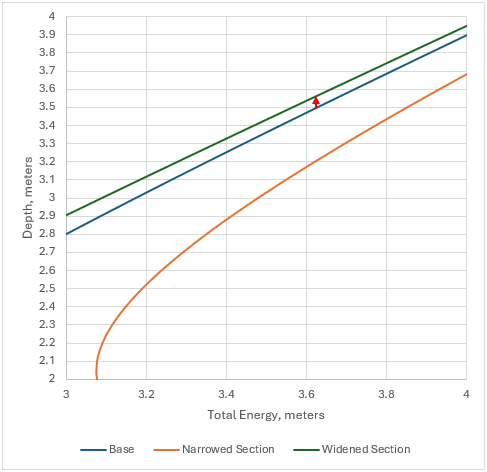
Correspondingly if you widen the channel to 14 meters, you would get an increase in depth to 3.56 meters as you shift from the blue curve to the green curve (Figure 5).
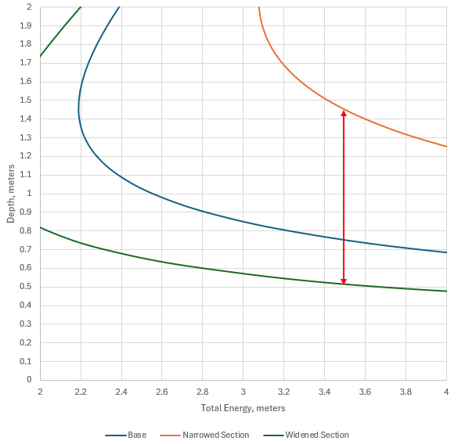
Now let’s say your 10-meter-wide channel is steep enough to produce a supercritical depth of 0.75 meters. This time if you narrow a section of the channel to 6 meters wide, the depth at the narrowed section would increase to 1.45 meters, and if you increase the channel width to 14 meters wide, the depth would decrease to 0.52 meters (Figure 6).
Once you start thinking in terms of energy instead of storage, the behavior at the constricted or widened section becomes much easier to understand.
The Bridge Example
Now let’s bring this back to a bridge opening. Suppose you have an existing bridge opening that creates a significant contraction of flow. As flow approaches the bridge, the opening forces the water to accelerate. To create that additional velocity (i.e. kinetic energy), the flow sacrifices depth (i.e. potential energy). The water surface at the bridge is lower than it otherwise would be. At the same time, the constriction creates additional energy losses that raise water levels upstream. This is the classic backwater effect.
Now imagine we widen the bridge opening. Everyone expects lower water levels everywhere. But that’s not quite what happens. Because the opening is now larger, the flow no longer needs to accelerate as much. Less acceleration means less velocity head through the constricted section. And if less energy is stored as velocity, more energy remains available as depth. The depth increases in the widened section.
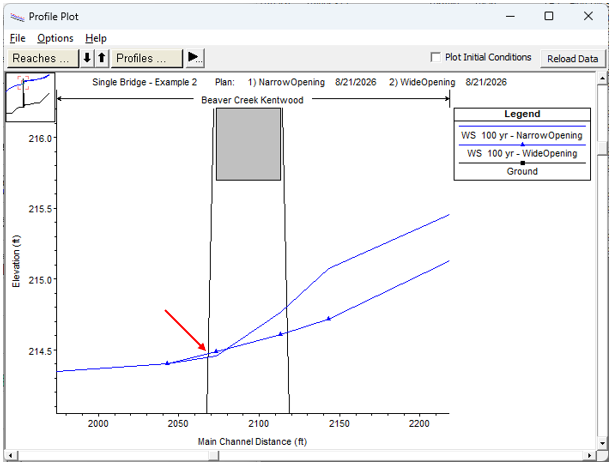
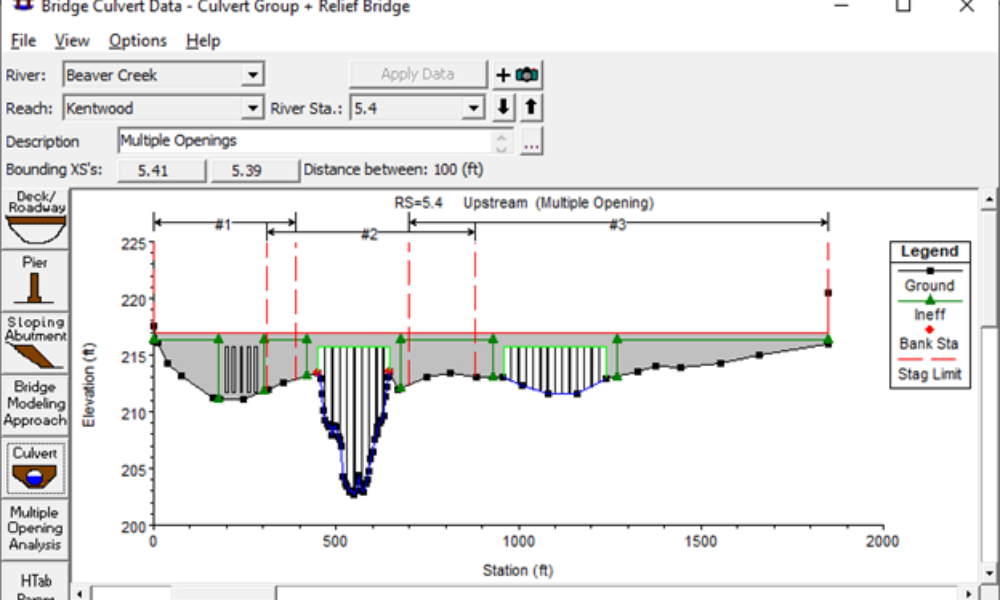
Right at or inside the bridge, you can expect a slight rise in the local water surface elevation when widening the opening. In HEC-RAS, this will generally be evident from the downstream bounding cross section possibly through the bridge opening, provided the flow remains below the deck. If the deck becomes submerged and pressure flow develops, the situation changes significantly, with additional hydraulic processes coming into play that can complicate this otherwise straightforward theoretical discussion. Eventually the profiles will intersect, showing a lowering in the water surface elevation upstream for the wider bridge opening, as expected. Where this intersection takes place under the bridge, depends on the amount of energy loss influencing the results. Figure 7 shows an example HEC-RAS model through a bridge section. Everything is equal, only the bridge opening is wider or narrower. The wider bridge actually shows a slight, but real rise just inside the bridge (see red arrow), before the profiles intersect just upstream (but still inside the bridge).
Why This Causes Confusion in FEMA Studies
This is one of the more common sources of confusion when reviewing FEMA no-rise models.
A reviewer sees that a project added conveyance. Then they notice a localized increase in water surface elevation at the structure. The immediate reaction is often:
“How did improving the opening make things worse?“
But it didn’t. The model is simply showing a redistribution of energy. The existing structure was forcing the flow toward a more contracted, accelerated state.
The improved structure allows the flow to remain deeper and slower through the opening while reducing overall energy losses through the reach. The local rise is often a sign that the contraction effect has been reduced, not increased. It is exactly what the specific energy curve predicts should happen.
Stop Thinking About Storage
The root of the misunderstanding is that many people instinctively view rivers as storage containers. If you make the container smaller, the water must rise. That logic works surprisingly well in reservoirs, tanks, and bathtubs.
It often fails in moving water.
Flowing water is not primarily a storage problem. It is an energy problem. A contraction changes how energy is partitioned between depth and velocity. The resulting water surface is simply the consequence of those energy exchanges.
Put It to the Test
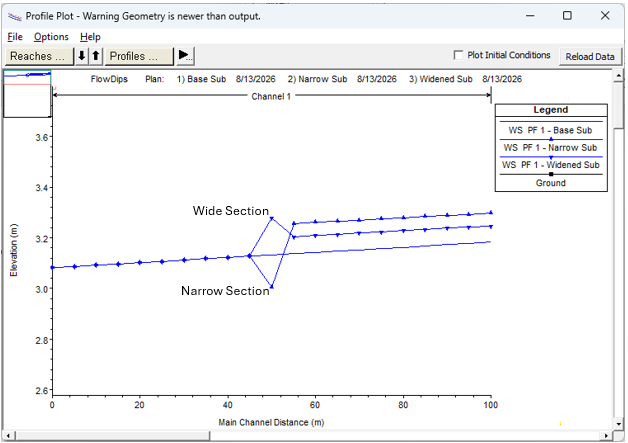
If you’re still skeptical, try the experiment yourself. Build a simple rectangular flume in HEC-RAS using a series of cross sections on a mild slope. Run it with a constant discharge and save the geometry as your baseline case.
Next, save the geometry under a new name and modify a single cross section near the middle of the flume so that it is narrower than the others. Then create a third geometry and make that same cross section wider than the baseline. Run all three plans using the same constant flow and compare the profile plots.
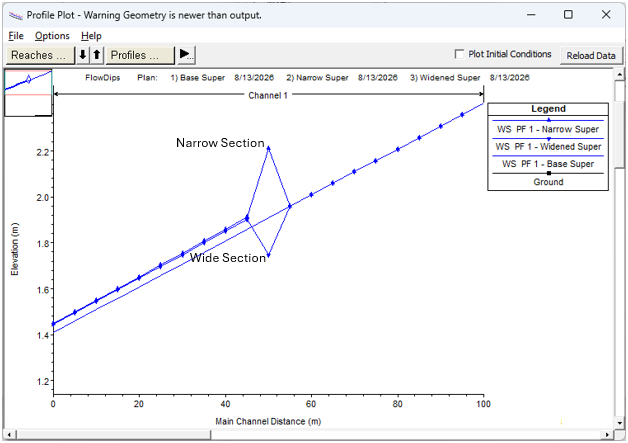
After that, repeat the exercise with a hydraulically steep flume so the flow is supercritical. Again, compare the results for the baseline, narrowed, and widened cases.
My results are shown in Figure 8 for subcritical and Figure 9 for supercritical. An interesting observation is that both the narrowed and widened sections cause an increase in water-surface elevation upstream of the modification in subcritical flow (and downstream of the modification in supercritical flow). The key difference occurs within the modified cross section itself, where the hydraulic response to the increase or decrease in cross-sectional area becomes apparent.
The Takeaway
When someone says:
“A wider bridge opening should make the water level go down.“
The best hydraulic answer is:
“Not exactly.“
In subcritical flow, widening a channel causes the flow to decelerate and the water surface to slightly rise at the widened section. But the associated reduction in energy losses will decrease the water surface upstream of the widened section.
And because the reverse is also true, decreasing conveyance will produce a local reduction of water surface elevations while raising flood elevations upstream.
Usually, these local rises or drops are small compared to the upstream effect. It’s one of those hydraulic results that feels wrong until you view the problem through the lens of specific energy. The flow isn’t asking how much space it has. It’s deciding how much of its energy should be stored as depth and how much should be stored as velocity.

Comments
The comments are closed.