Forum Replies Created
-
AuthorPosts
-
September 26, 2019 at 2:10 pm in reply to: Abnormally high critical depth elevation and wrong total discharge in 1D model #12532ZoranParticipant
Apparently there is a bug according to the computation of the critical depth elevation in version 5.0.7 as mentioned in this post . Indeed, I ran my model with version 5.0.3 and the bug disappeared.
I still couldn’t find out why in my unsteady simulation the discharge is varying so much from one section to another and is sometimes negative.
ZoranParticipantHi NicoB,
I have the same problem as you in QGIS 3: the levees stationing are correct, but the elevations are missing.
I managed to overcome this problem like this:
1. v.sample (GRASS tool) -> LeveePoints as defining sample points + DEM as raster map to be sampled -> run
2. Join (layer property -> Joins) LeveePoints to the newly created output layer (in my case it’s called Sampled)
3. Update the field Elevation of LeveePoints with the field calculator by indicating the name of the joint column
4. Remove the joinHope that helps.
May 29, 2019 at 11:32 am in reply to: Influence of local cell mesh size and average time step on water depth #12247ZoranParticipantGreat thank you for your advice!
May 28, 2019 at 11:37 am in reply to: Influence of local cell mesh size and average time step on water depth #12245ZoranParticipantApparently opening the output log file from Option -> View computational log file is not working on my computer. There is a pop-up message that appears which indicates : “Note – There is not a log file to view”.
I finally managed to obtain the desired .bco## file by removing the old .bco## file and running the simulation again. After that, I could open the file with notepad directly from the file explorer. It was located in the folder where is save my plans.
According to my simulations, I would assume that the smaller the grid cell size is, the more accurate the model becomes, right ? This is true as long as the Courant number is close to 1 (which ensures that the ratio time step versus cell size is correct). So what I should do is to progressively decrease the grid cell size while adapting the time step with the Courant number, check if the solution converges, and once the solution is stable keep the associated mesh ?
Please correct me if I’m wrong.
Best
May 24, 2019 at 4:10 pm in reply to: Influence of local cell mesh size and average time step on water depth #12243ZoranParticipantHi Luis Partida,
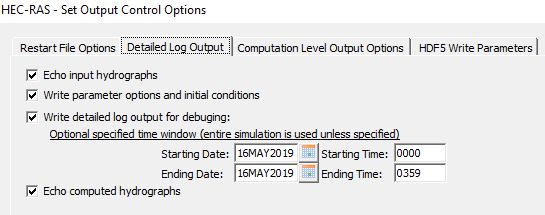
I don’t know how to access to continuity error. I cannot check the Computation log file after running my simulation (which is stabke) even if I activate the Detailed Log Output. It appears no .bco01 file is generated by RAS. This file should contain the Unsteady Flow Log output file. I use RAS version 5.0.6.
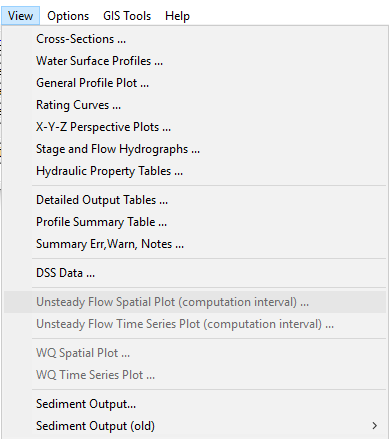
Also it is impossible to access to the Unsteady Flow Spatial Plot and Time Series Plot in the View menu.
What can I do in such situation?
-
AuthorPosts

