Forum Replies Created
-
AuthorPosts
-
ZoranParticipant
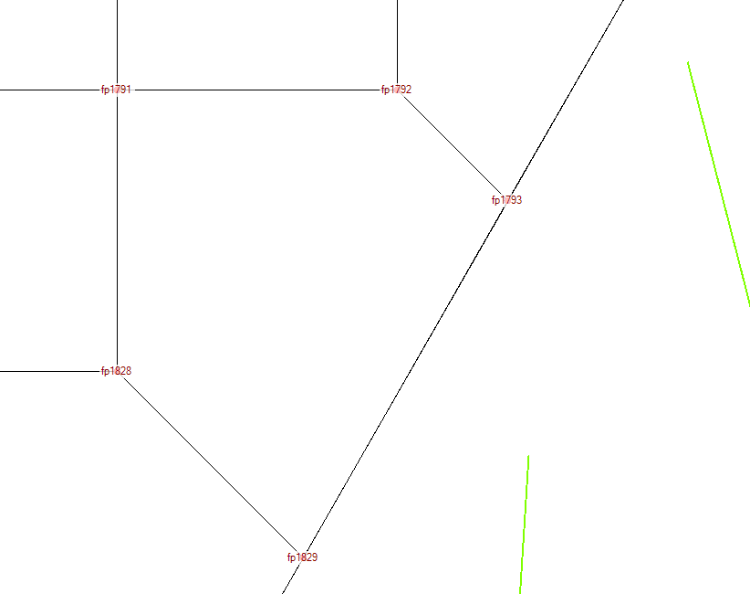
I’m trying to understand how the connections between river XS and the LS weir are defined and what influence it has on the results to choose a “right overbank” or “next to right bank station” type connection.
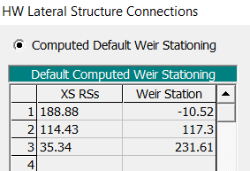
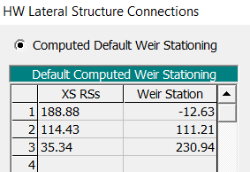
I observe that the weir stationnings change in the HW lateral structure connection table when I change the connection from “right overbank” to “next to right bank station”. However, I struggle to understand how these distances are calculated by HEC-RAS?
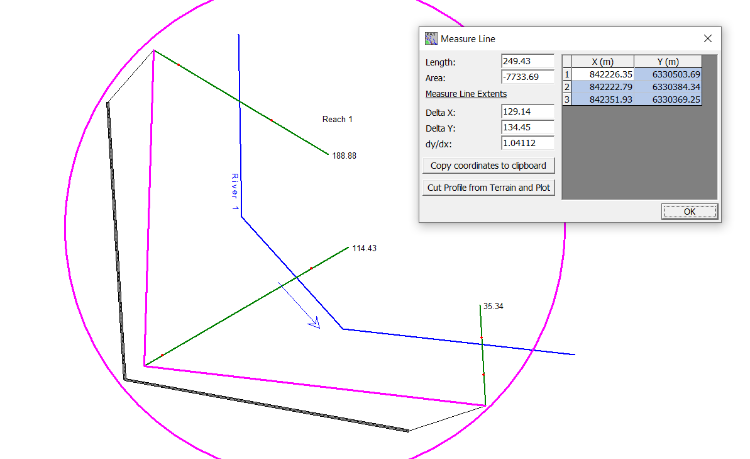
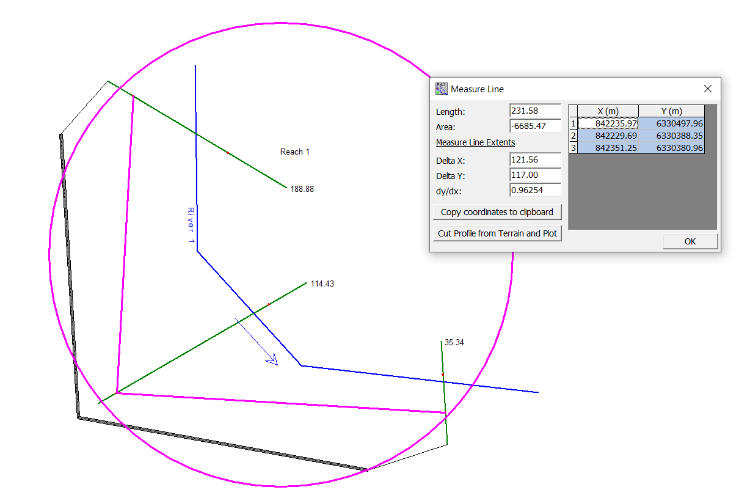
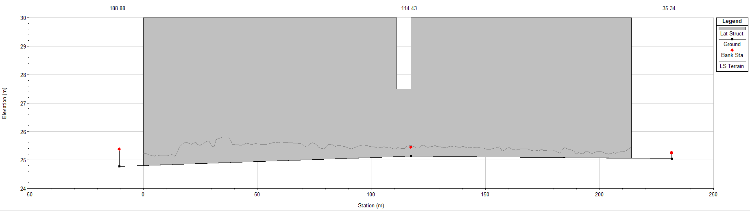
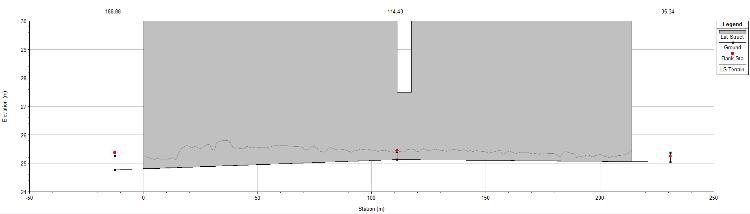
From what I understand, if “right overbank” is selected, the LS is positioned at the end of the XS, while if “next to right bank station” is selected the LS is positioned at the right bank stations. When I compare the distance between the right bank stations I get the same result as indicated in the corresponding table of HW lateral structure connections (231.6 m). On the other hand, I do not obtain the same result when I compare the distance between the ends of the XS with the corresponding table of HW lateral structure connections (249.4 m instead of 230.9 m).
I don’t understand how the distances are calculated in the HW lateral structure connections table?
For the positioning of the LS, it seems to me that the most correct solution is to connect the LS to what is really closest: right overbank or next to right bank station. It seems to me that once the water level in the XS has reached the level of the weir, water starts to overflow in the 2D flow area / SA. So even if there is an overlap, the volume shouldn’t be counted double (cf. Lonnie’s post)?
The choice of a HW position can have an influence on the simulation results as shown in the following figures.
 October 7, 2020 at 12:18 pm in reply to: Comparison of the flow over a weir in the geometry editor and RasMapper #12961ZoranParticipant
I think I have found an answer to my question.
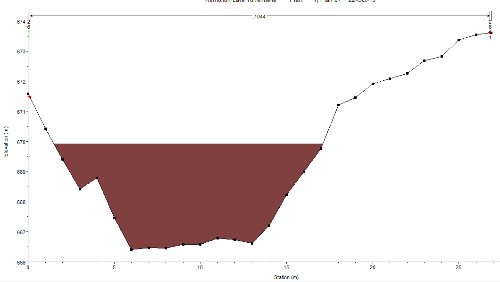
For this I created a retention basin with a single overflow in which I injected a constant flow of 2 m3 / s. I then compared the graphics obtained in the geometry editor and in the RasMapper.
It appears that the graphs given by the geometry editor are correct: following the filling of the basin, we observe a constant output flow rate of 2 m3 / s.
Regarding the graphics given by the RasMapper, it appears that the positioning of the profile line influences the result! Indeed, when the latter is parallel to the weir but shifted by one cell, the results are correct (cf. PL top and bottom in the figure). On the other hand, when superimposed on the weir, the flow rates are too high (sometimes far too high).
Maybe this is explained by the fact that the RasMapper artificially adds the back and forth movement of water above the structure (oscillations)?
In conclusion :
– the results of the geometry editor are correct
– the results of the RasMapper are correct as long as the profile line is not positioned directly on the structure (the profile line must not be magnetized to the structure)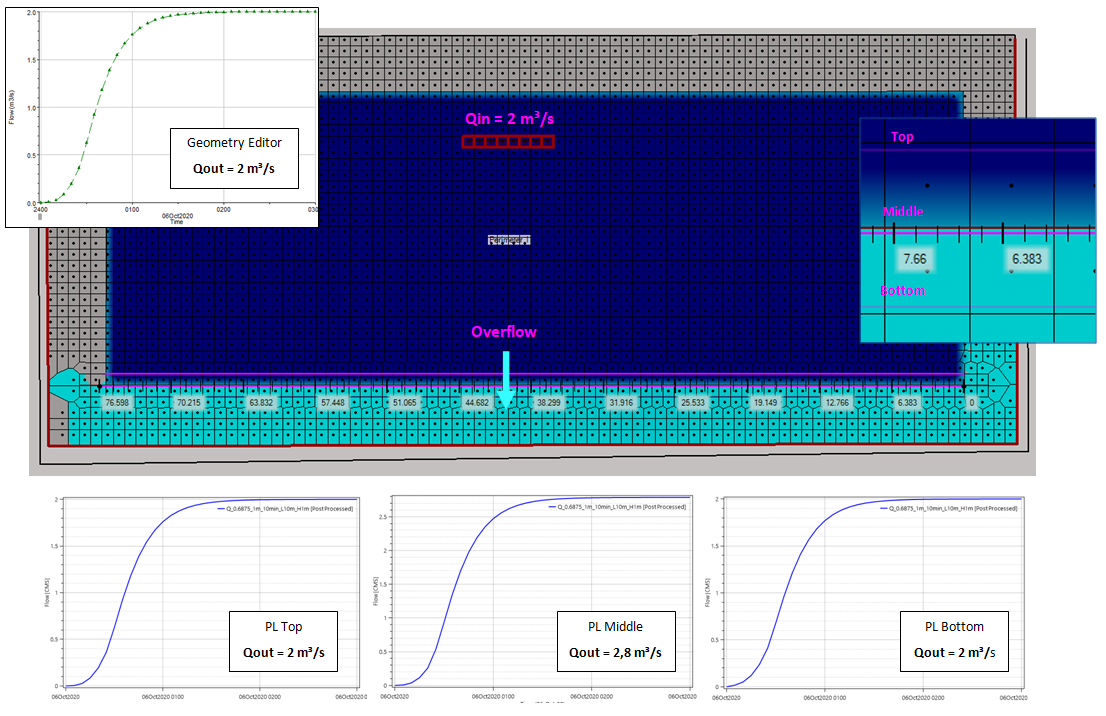 August 25, 2020 at 7:14 pm in reply to: Relation between 1D interpolation distance and 2D mesh size #12919ZoranParticipant
I will run a simulation after changing the weir coefficient value.
I usually have the impression that the model becomes less stable when I turn on the 2D equations, but maybe I’m doing something wrong.
When I turn on the 1D/2D iteration option (3 iterations), the model becomes very slow.August 25, 2020 at 11:29 am in reply to: Relation between 1D interpolation distance and 2D mesh size #12917ZoranParticipantMy weir coefficient is 0.5 is SI units. It is lower than the default weir coefficient (1.1 if I remember properly), so less water can flow from the 1D to the 2D area.
When I use the 2D equations the model crashes.
August 24, 2020 at 6:29 pm in reply to: Relation between 1D interpolation distance and 2D mesh size #12915ZoranParticipantThe weir equation was used for the lateral structures. I ran the model with a time step of 1s and 0.5s but it had no effect on the blue spots. I didn’t know that it was possible to use different time steps for the 1D and the 2D. I only know that it is possible to adjust the time steps according to the number of Current. The channel is included in the 1D. I cut my cross sections at the banklines and the 2D areas start after this point more or less.
February 8, 2020 at 4:19 pm in reply to: Raising / lowering cross sections from the inversion elevation #12720ZoranParticipantDear Cameron,
This is also what I thought.
I plan to write a python script for QGIS which can do this. If it works well I’ll share it with the community.Regards,
ZoranFebruary 3, 2020 at 1:35 pm in reply to: Raising / lowering cross sections from the inversion elevation #12718ZoranParticipantDear Cameron,
I realize that my question was not clear.
I am trying to modify my cross profiles interpolated in a gradual and natural way from the invert elevation.
Here is a schema that summarizes what I want to do:
Left figure: the shape of a cross-section when only the invert point is modified -> this risks causing discontinuities in the profile
Right figure: the look of a profile that has been gradually modified from the bank station to the invert station. The correction (delta) is maximum at the lowest point and zero at the banks. If L is the distance between the bank station and the invert station and x is the distance between an arbitrary station and the bank station, the correction of the elevation at each station is given by the following relation: dY = x / L * DY.
Hoping to have been clearer.
Zoran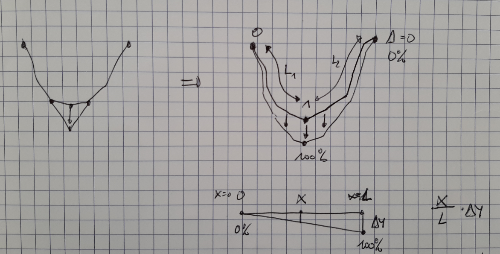 January 31, 2020 at 1:30 pm in reply to: Raising / lowering cross sections from the inversion elevation #12716ZoranParticipant
Dear Cameron,
I looked for an answer to my problem using the channel design / modification tool and the vertical datum adjustement tool.
Regarding the channel design modification tool, I can’t find a way to modify only the channel invert without applying an arbitrary template (which would completely modify my profiles)? It seems to me that the column Fixed Elev. is used to wedge the invert elevation of the template but does not allow to modify only the invert value.
Regarding the vertical datum adjustment, it allows me either to shift all the points in my profile(s) by a certain value, or apply the modification on the channel or overbank. I have not found how to shift only the invert channel.
Regards,
ZoranZoranParticipantThank you Jarvus. Now it makes sense:
 ZoranParticipant
So I investigated the possibilities that offers the “fixed sediments elevation” tool in the geometry editor, which seems to partially answer my question :
– I managed to fill my profiles with sediments under a certain altitude by indicating the US XS and the slope that I needed.
– I did not manage to use the sediment elevation for the XS elevations (the method does not change the profiles geometry, so when I export my interpolated XS in Ras Mapper I obtain the original elevations. I need to do this for my full 2D model…)Any idea how to fix this?
Thank you,
Zoran
 ZoranParticipant
So is there a way to know how the facepoints are numbered? There is the possibility to indicate “user defined weir stationing” but for that I imagine I should know which facepoints are limiting my LS.
Thank you,
Zoran
PS: Usually I use version 507, but this time I had to do a test with version 503.
ZoranParticipantThis is what I did finally.
The problem is that this procedure takes a lot of time and it is easy to do a mistake…
I am wondering if the tool “fixed sediments elevation” in the geometry editor could be a solution to my problem. I will try it asap.
Anyway thank your for your support.ZoranParticipantEnter a value in the Max Depth column. With your mouse go to the lower-right corner of the cell and your mouse should change to a black cross. Click on the cross and drag it down to copy the value to the next cells.
ZoranParticipantAccording to this paper from 2018 (Quasi-unsteady flow calculation), p. 32-33:
“However HEC-RAS does not allow for a mixed flow regime simulation to occur within sediment transport modelling, so solutions that have supercritical values are not valid solutions. If the solution is supercritical, the model will display an error message and set the water surface to the critical depth(Brunner & CEIWR-HEC, 2016).”
ZoranParticipantI obtain the same error as Uros.
Nevertheless, I cannot find in the reference manual that it’s not possible to run a steady 1D-2D model.
Any idea about where I can find more information about this? -
AuthorPosts