Forum Replies Created
-
AuthorPosts
-
Scott MillerParticipant
You will need to leave enough of a gap between lateral structures so that no 2D cell has more than one lateral structure connected to it. You can add or move calculation points to accomplish this, or choose the ends of the lateral structure centerlines accordingly. I believe you can leave gaps as long as any high ground that does not become inundated along the center line.
I found that my model appeared to be losing flow between lateral structures. (About 2% error in the 1D reach. I could see particle traces in the 2D flow area accelerate to lateral structure gaps.) So I have reconstructed my lateral structures to end at the highest points along the flood plane. I believe this is like what Chris Goodell meant by “Do not have cells adjacent to the lateral structure that reside completely on the slope of the levee/berm/whatever you’re modeling with the lateral structure.” I would construct a short berm on the elevation model if there were otherwise no high ground.
For a point of reference, in my model the minimum flow tolerance has ranged from about 0.25 to 1.5 m^3/s for a reach about 1 km long on a stream that gets perhaps 12 m^3/s during an extreme event. I believe the minimum flow tolerance applies to each lateral structure.
Scott MillerParticipantThank you. In the figure the lateral structure is using normal 2D calculations.
Scott MillerParticipantHi Anthony.
I’ve dealt with some of the same things as you and think I can help a little. Take a look at this blog post regarding your first two questions: http://hecrasmodel.blogspot.com/2016/07/weir-equations-in-hec-ras.html
Regarding your third question take a look at this thread: http://hec-ras-help.1091112.n5.nabble.com/1D-2D-Flow-Exchange-amp-Minimum-Flow-Tolerance-td5485.html
Jarvus’ response to my question was helpful. Take a look at the mass-balance error in the computation log file under options. The 1D/2D flow errors you’re getting might not be so bad if your model is stable.
The lateral weir you show in your post is almost 1200 meters long. A lot of flow can pass across that boundary in a single time step. I think you could increase your minimum flow tolerance and 1D/2D iterations. (Your minimum flow tolerance seems incredibly low.) In the blog post linked above Chris Goodell wrote in reply to Toby:
As far as advice to reduce 1D/2D flow errors over lateral structures: Break up long lateral structures into multiple smaller ones. Be careful not to use too high of a weir coefficient. Do not have cells adjacent to the lateral structure that reside completely on the slope of the levee/berm/whatever you’re modeling with the lateral structure.As far as I can tell from the 1D velocities in your post, the 10-second time step ought to satisfy a Courant condition for the size of your cells. I’m assuming the velocities in the channel are the highest.
Scott
June 5, 2018 at 7:21 pm in reply to: Too many connections. Reduce the number of connections to NCON_STORE_MAX #11426Scott MillerParticipantAre you able to use 5.0.4? Refinement regions may allow you to use fewer 2D flow areas.
June 4, 2018 at 8:25 pm in reply to: 1D Profile Drops to Zero WSL & EGL along Lateral Weir 2D Connection – see im #11282Scott MillerParticipantThank you Luis.
I see the section on Lateral Structure Weir Coefficients in the 2D Modeling Users Manual. For the case where I am using lateral structures to connect 1D channel to 2D overbanks, the default weir coefficient, 2, is much too high. Good tip.
Chris Goodell makes some helpful points in his response to Toby in this post: http://hecrasmodel.blogspot.com/2016/07/weir-equations-in-hec-ras.html
The phantom breaches in my model do not appear anymore. It is a mystery what caused them.
June 4, 2018 at 7:42 pm in reply to: Error computing 2D Flow area tables: Array dimensions exceed supported range #11420Scott MillerParticipantThat looks like an error I was getting when importing a terrain in 5.0.3. It turns out when I exported the elevation TIFF from ArcGIS, the default value for areas with no data was an obscenely large number, -1.797693e+308. I changed the no data value to something smaller, -999, and had no more problems with the terrain.
May 25, 2018 at 7:28 pm in reply to: 1D Profile Drops to Zero WSL & EGL along Lateral Weir 2D Connection – see im #11279Scott MillerParticipantWith 5.0.4 I rebuilt the 2D area and lateral structures. Refinement regions made those scores of manually added calculation points a thing of the past. It was not strictly necessary to rebuild the lateral structures, but made sense to get them on about the same length scale. The minimum flow tolerance applies to them all equally.
Lengthening the lateral structures in a reach where flow goes rapidly overbank, and back, appeared to be the cause of new 1D model instability. It would have made sense to re-shorten the lateral structures in that reach. Instead, I first switched back from weir equation to normal 2D equation for the lateral structures. The model stabilized, and there were no phantom breaches anymore.
Maybe it helped that I lined up the head and tail ends of left and right bank lateral structures. Maybe it helped that I paid more attention to putting their ends near model cross-sections (non-interpolated). I don’t know. Maybe 5.0.4 works better for a reason I’m unaware of. In any case the model is faster and smoother.
Scott MillerParticipantJake. Don’t worry about the texture you see. 2D HEC RAS reads cell volume and face cross-section from the terrain, not the roughness. You can use a land-use layer for roughness or digitize it in manually.
One thing to consider is whether the channel topography shown is the dry bed or the water surface. You may need survey to get the channel bottom.
My understanding is that the flattened contour bands would mess with the rendition of inundated areas in 2D. Consider that a sloped water surface will cross those steps.
Are you planning to use full 2D, or use 1D for the main channel?
Scott MillerParticipantThank you, Chris.
There are definitely some long and narrow parts in my 2D area. I’ll choose a discreet, intense storm and do some speed vs. core testing. (It looks like I should start with comparing 5.0.3 and 5.0.4!)
Please consider touching on how to configure a smart 2D area in your blog. Thanks again.
Scott MillerParticipantThank you jarvus. I’ll check the mass balance error when this model finishes tomorrow. I’ll try a smaller time step (1s) after building a computer for 2D modeling. A two core laptop really doesn’t cut it.
Scott MillerParticipantThank you, Luis. I could definitely adjust the max heads down. I set them to accommodate overtopping the roadway, but overtopping is not likely to happen as long as the culvert is free flowing. Tighter curves may throttle down the flow instability.
I like the idea of isolating the problem and modeling it separately, but not in this case. A downstream control may backwater the culvert. Channel slope in this area is about 0.0015. That is surely part of the problem. Head difference is small, so there are likely pockets in the flow curves that defy convergence. Adjusting the maximum heads ought to help. I anticipate trying this late this week.
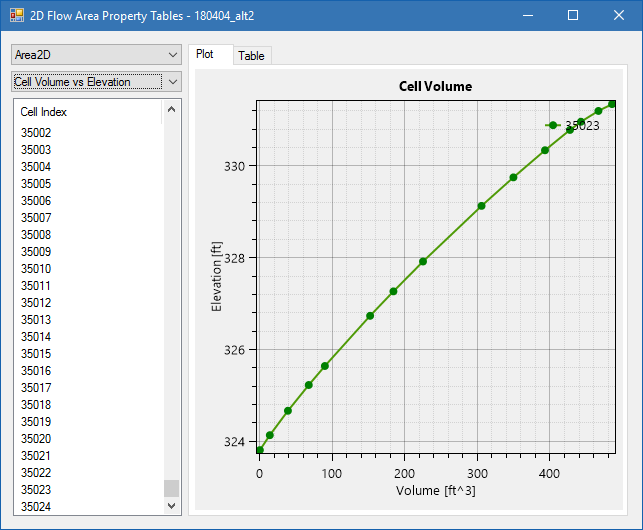
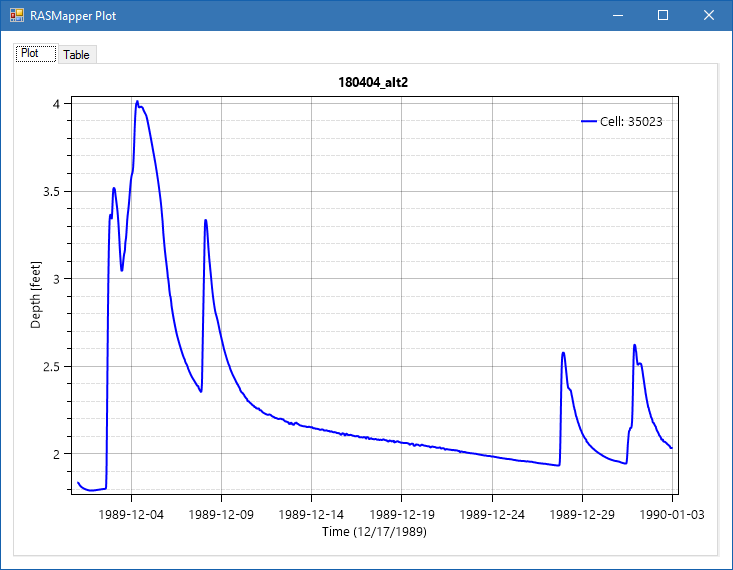
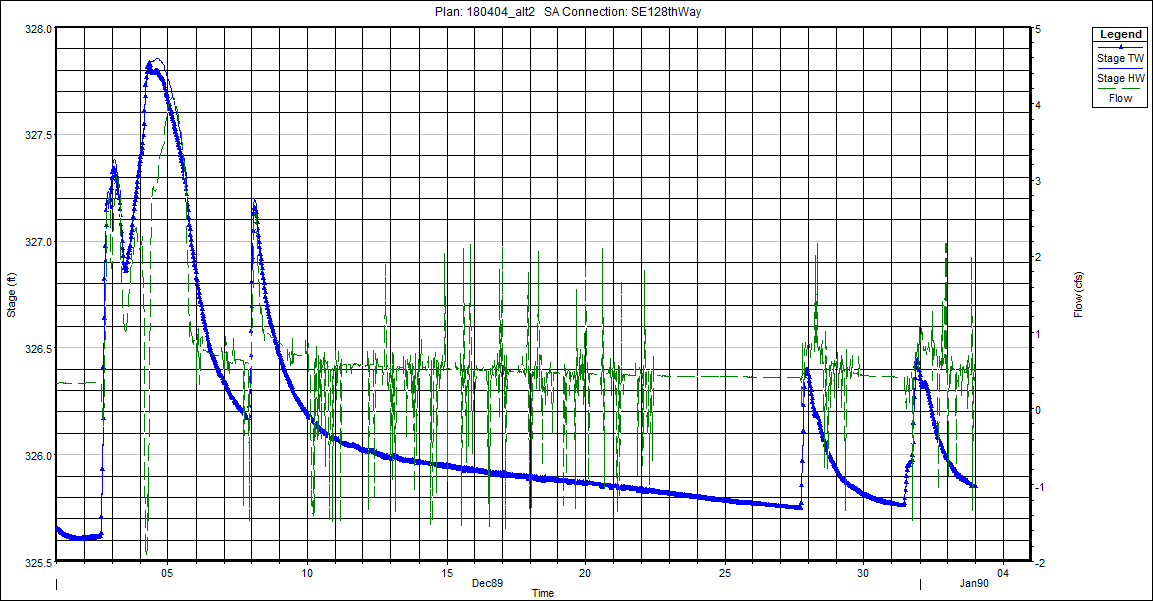
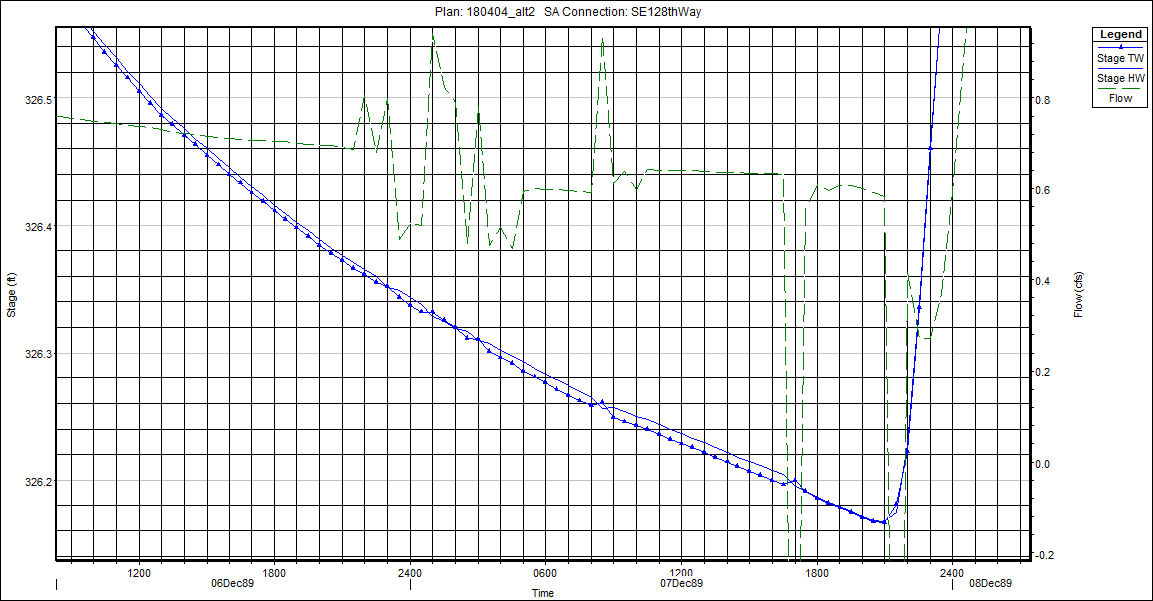
Scott MillerParticipantI am including four plots in this post. Each shows characteristics of the troubled cell or 2D area connection.
1. Stage-Volume for the cell
2. Depth TS plot for the cell
3. Stage and flow hydrograph for the connection
4. A detail of the stage and flow hydrograph for the connectionThere is a uniform flow of 0.25 cfs added to the upstream area. I thought a positive flow might help the stability of culvert calculations. There are time series of inflows both upstream and downstream of the 2D area connection. It is possible for head to rise faster in the downstream area than in the upstream area.
It does not look like the volume of the cell is limiting. Only 4 feet of the 7 foot depth is used during the larger storm in this period. Maybe I misunderstand what the problem would be. Why would the cell need to be stretched?
There appears to be instability in the flow through the 2D area connection. Zooming in on the head and tail water stages reveals that the flow instability occurs when hydraulic head alternates between upstream and downstream cells.
Resolving this ought to allow the 2D area to converge in fewer iterations, and may allow a longer time step. I guess one way to deal with it would be to put a flap gate on the culvert, though there is not actually a flap gate on the culvert. Another possibility may be to disregard the hydraulics of the culvert altogether and put in a large box culvert or remove the weir and culvert altogether. I’m not sure that how that latter would affect the grid.
I’d like to see your suggestions.
 Scott MillerParticipant
Thank you Cameron and Luis. The base cell size in my grid is 16×16 feet. The terrain is mostly flat, but I estimate velocities of 4 to 6 feet per second are possible in some areas. I’m using the diffusion wave equation in the model. So the time step would be 5 seconds, maybe 10 seconds if the velocities peak at 3 feet per second. With the added nodes a lot of cells are about 11.3 feet on four sides. Considering Courant criteria, a 2 or 3 second time step ought to be about right. In practice, though, I settled on 2 seconds as a time step bookended by instabilities in the 2D or 1D area at shorter or longer time steps, at least at the flows with which I was ramping up the model.
I’ll have a better idea of what is going on with the problem grid cell on Friday. It’s taking 60 hours to model a 33 day period. I’ll write about what that cell is doing in 48 hours. Thanks again.
Scott MillerParticipantYou could manipulate the n-value to represent losses due to turbulence and blockage of the channel, but you would be tweaking a calibration parameter. Can you cite other studies where n-values were empirically determined for in-channel wood debris? You could use such studies to modify your model, after you have it calibrated.
Have you accounted for why you would use a 1D model instead of a 2D or 3D model?
Scott MillerParticipantDo the elevations of your ‘flooded’ cross sections look correct, or does the water surface elevation appear to be too high?
How did that downstream boundary condition look? If that’s not it, maybe your model has a stability issue. Show a profile plot – with water surface and energy grade line.
-
AuthorPosts