Forum Replies Created
-
AuthorPosts
-
robdirParticipant
Thanks Cameron for your response.
This is what I’m talking about.
My picture was an example (simplified in 1D direction) referred to the evaluation of the Volume-Elevation points reported in the property table.
I believe that HEC-RAS reports the couples points extracting the elevation values from DEM and evaluating the Volume for each of it.
Just something like this command used in ArcGIS (or others GIS softwares) :http://webhelp.esri.com/arcgisdesktop/9.3/index.cfm?TopicName=How%20Surface%20Volume%20%283D%20Analyst%29%20worksI checked it on the single cell and I obtained similar results 😉
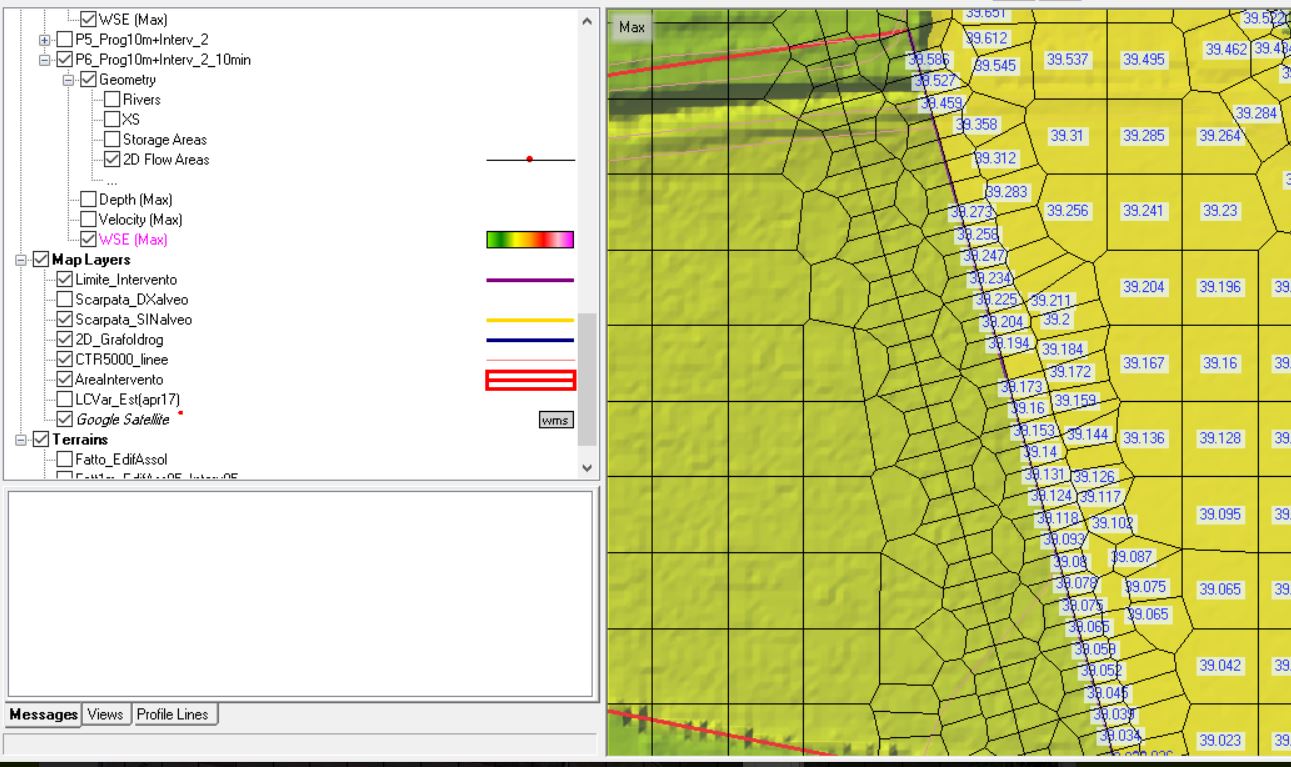
robdirParticipantI was talking about Elevation-Volume Table (and Plot) referred to the single cell.
If I read the values from the RasMapper in any cell I find a table like this:I was asking for the criteria used to evaluate the values reported on the table and graph.
I checked some cells and I found that the Max Volume (last point in the table-plot) was referred to the max depth inside the cell (in some cases located in the middle of the cell or in other positions away from the faces).
So I think that the Elevation-Volume points are extracted from the DEM inside the cell like a Surface-Volume calculation used in GIS application.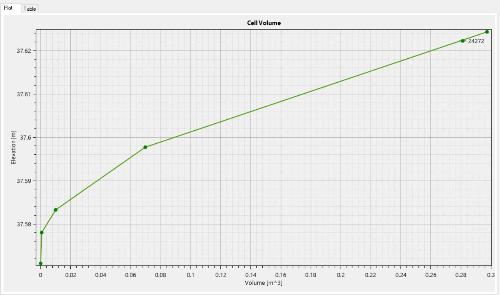 robdirParticipant
Hi Luis, I don’t think so. If I have the higher (or the lower) elevation inside the cell (not on the face) how could it be considered?
If HECRAS takes only the cross sectional face, this point shouldn’t be taken in account.
I think the program calculates the volume below the plan at different Z heights (until Zmax).
It should be something like this: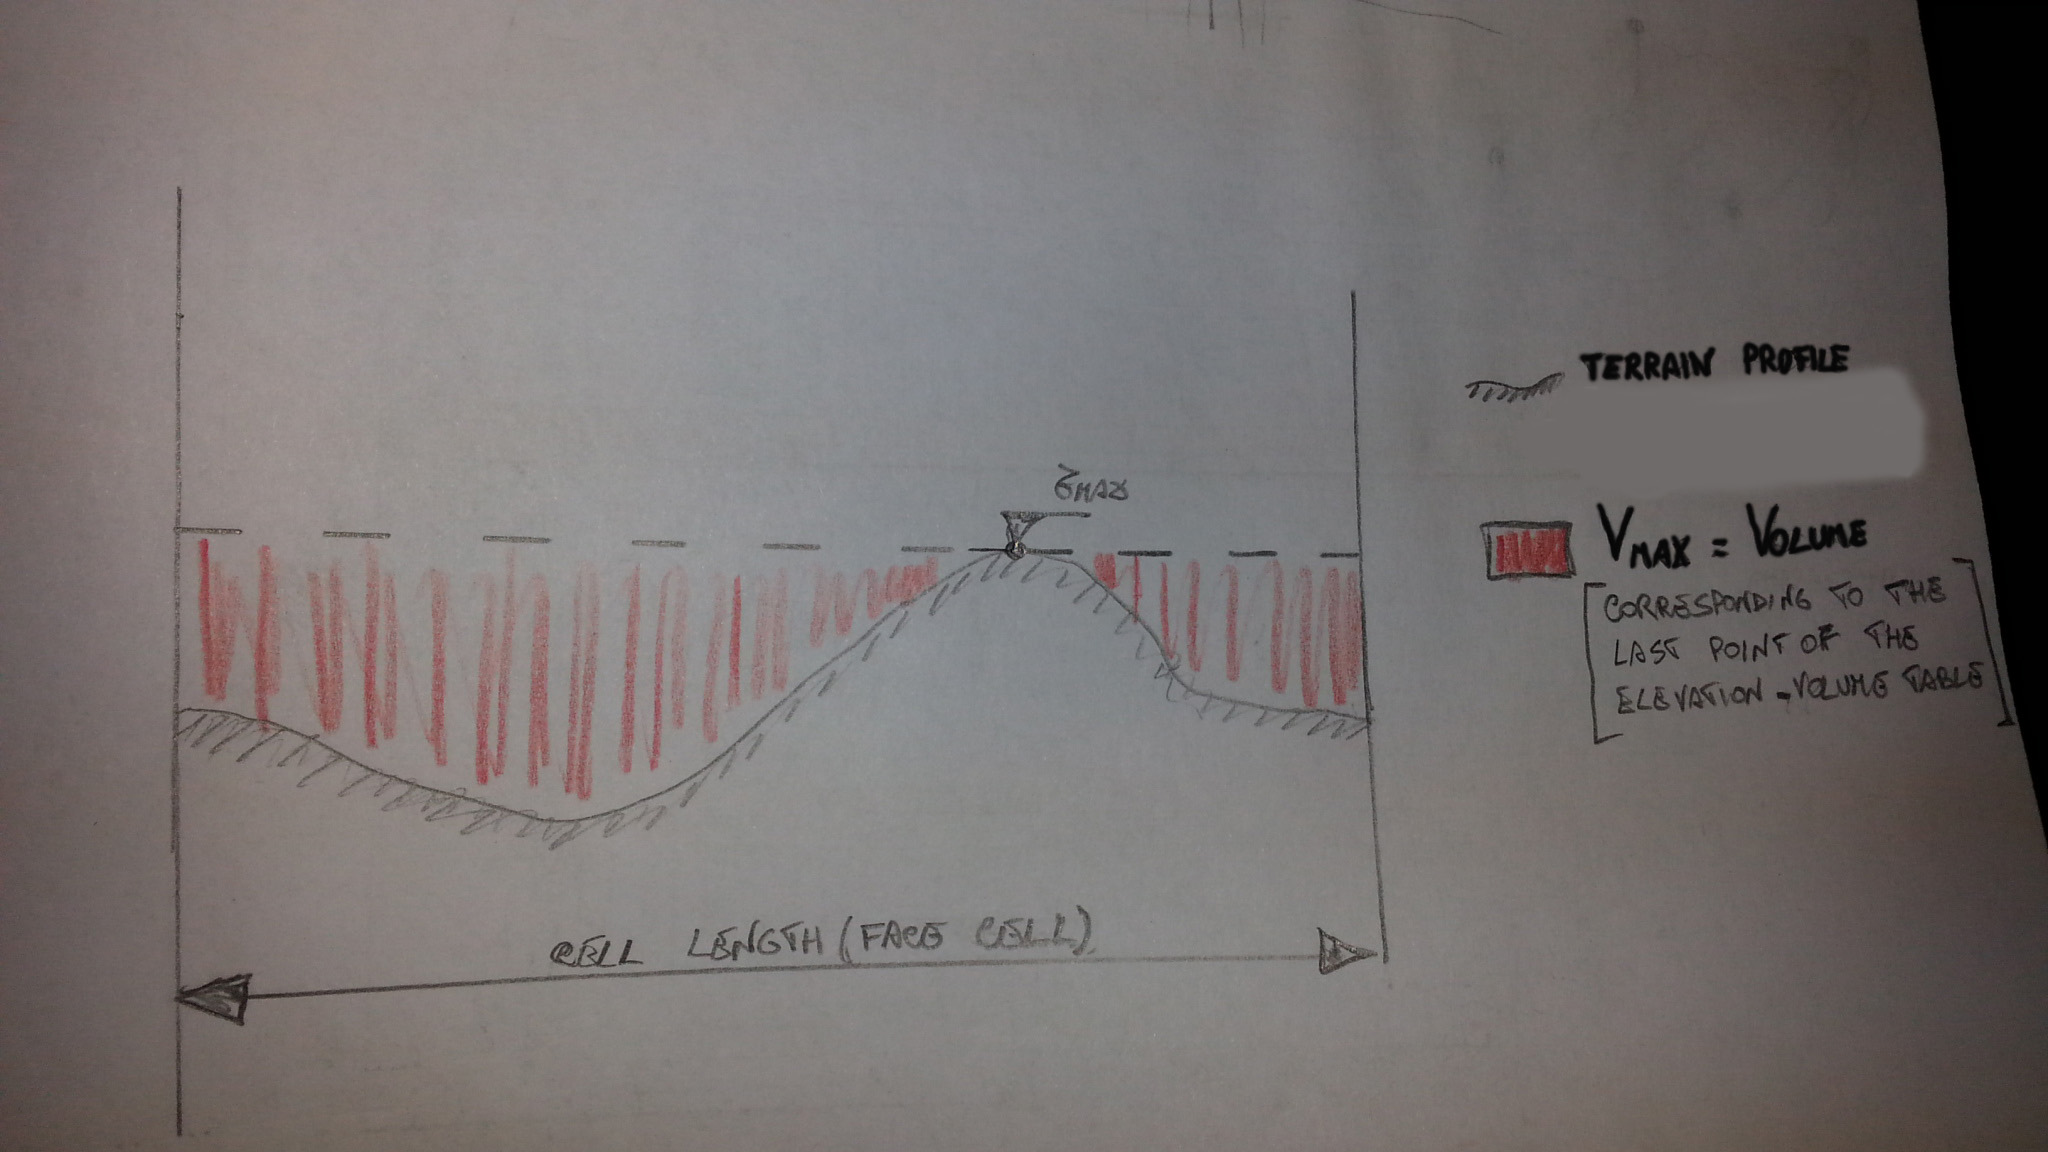 robdirParticipant
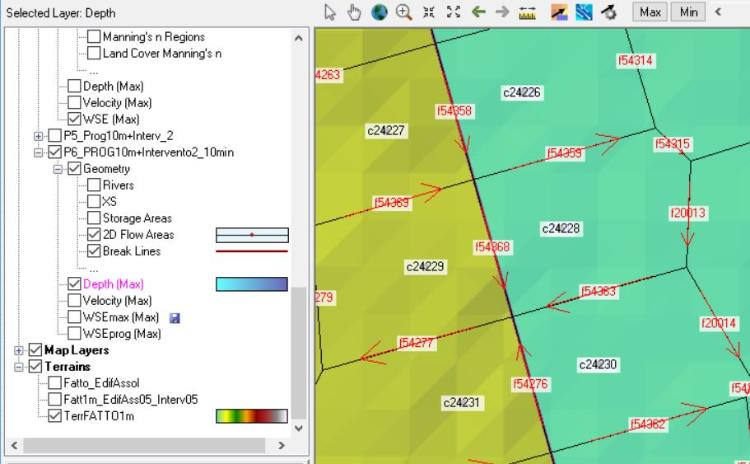
Lonnie this is my doubt… How are oriented the cell faces?
Along a 2DArea Connection I have this situation:Look at faces 54868 and 54276: why do they have opposite directions???
 robdirParticipant
Hi Cameron,
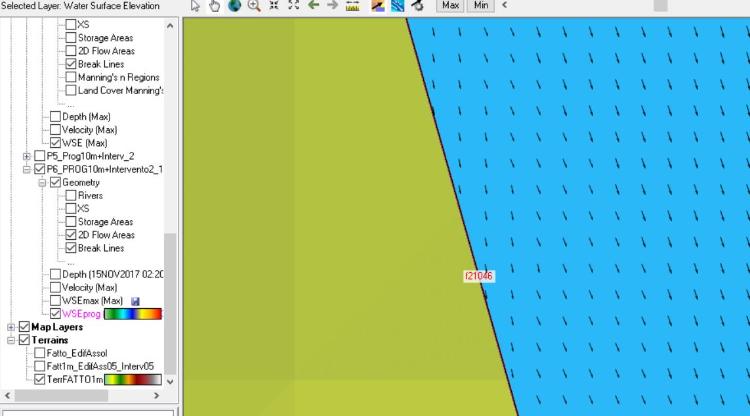
what do you mean as “which way the flow is positive…”?
I have this flow direction for every time step:So I didn’t understand how is possible that the face “21046” (for example) was considered with a “flow direction” positive in opposite direction…
Can you explain me, please?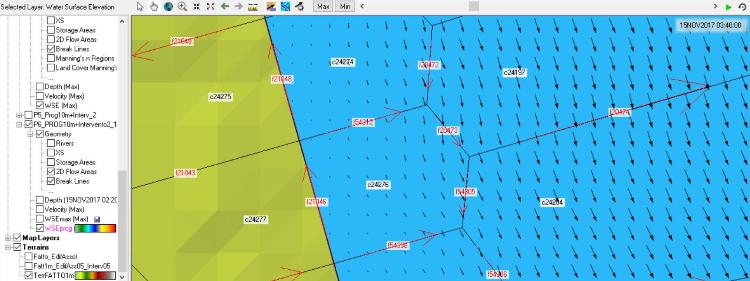
 November 29, 2017 at 10:13 pm in reply to: Hydraulic Structures inside of 2D Flow Areas (Where is HW an TW??) #11054robdirParticipant
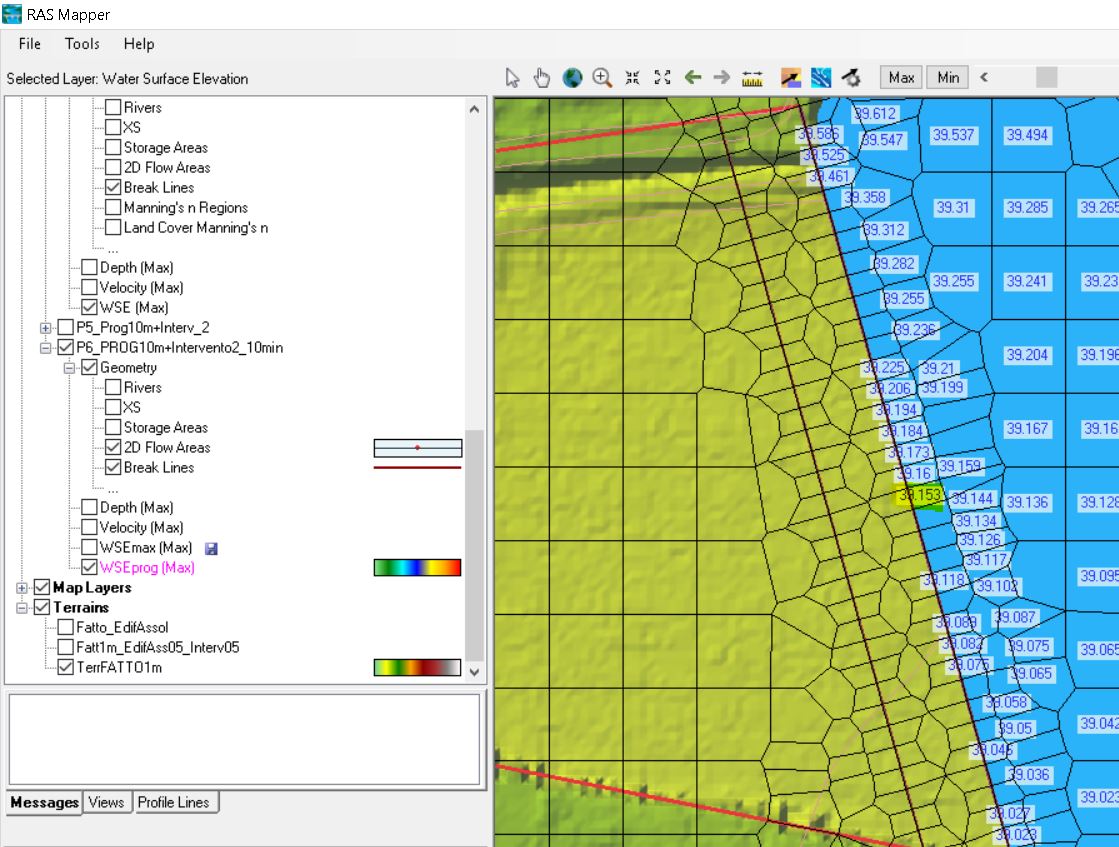
Sorry, I used similar colors for the WSE… In this image you can see that there is a WSE on the right side (referred to image) of the structrure
I highlighted (yellow colour) the WSE cell value that matched the max TW reported in Stage and Flow Hydrograph. I also checked the HW value: it was referred to corresponding cell on the left side of the structure (in this case it is the terrain elevation value = constant ).The cell highlighted was placed just at middle point along the “connection” line, so I can confirm that the max values reported in the StageFlowHydr are referred to the two cells (right and left side of the structure) corresponding to the middle point of the centerline connection (N.B.: the middle point was calculated consdering the Weirsta/Elev length- see Polyline Lengths in SA/2DAreaConn Centerline Table).
I’m searching for others simulations to verify this assumption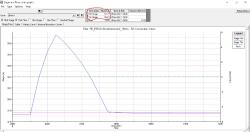
 robdirParticipant
Thanks jarvus, now is clearer.
1)I noticed that the cell position respect your observations.
It seems that program starts from upper side of 2d “Contour” Mesh, to assign the position of cell points (spaced along horizontal lines if dx=dy and along parallel lines for breaklines).
Later it builds the cells according to Delaunay and Voronoi diagrams.
I’m still not finding anything about point’s position from the boundary sides, but I can be
satisfied, for now2) I made some attempts with version 5.0.3 and I forgot to set Horizontal Render
mode!?!
When I did it, I checked come cells and I noticed that the water surface values referred
to the max values calculated on the minimun cell elevation.
So, the Cell Center Point doesn’t have an elevation value, it is only used by HECRAS to
assign the water surface (max values based on the min cell elevation).
When you click on any cell in RasMapper, you can notice that is reported only a water
surface cell value… it is referred to the “time variation” of max water surface (WSE,
Depth) calculated in the cell and referred to the min cell elevation.
This value is assigned to the cell center point to solve the hydraulics equationsCan you confirm my observations?
Thanks for your supportNovember 28, 2017 at 7:51 pm in reply to: Hydraulic Structures inside of 2D Flow Areas (Where is HW an TW??) #11052robdirParticipantThanks Lonnie, but I’m not sure…
I have a similar situation but my structure (hypotetical levee) wasn’t “surmonted” .
I tried to search for WSE elevations from cells along the connection (levee) but I didn’t find the matched values.
Where is located the profile that you posted?
This is my case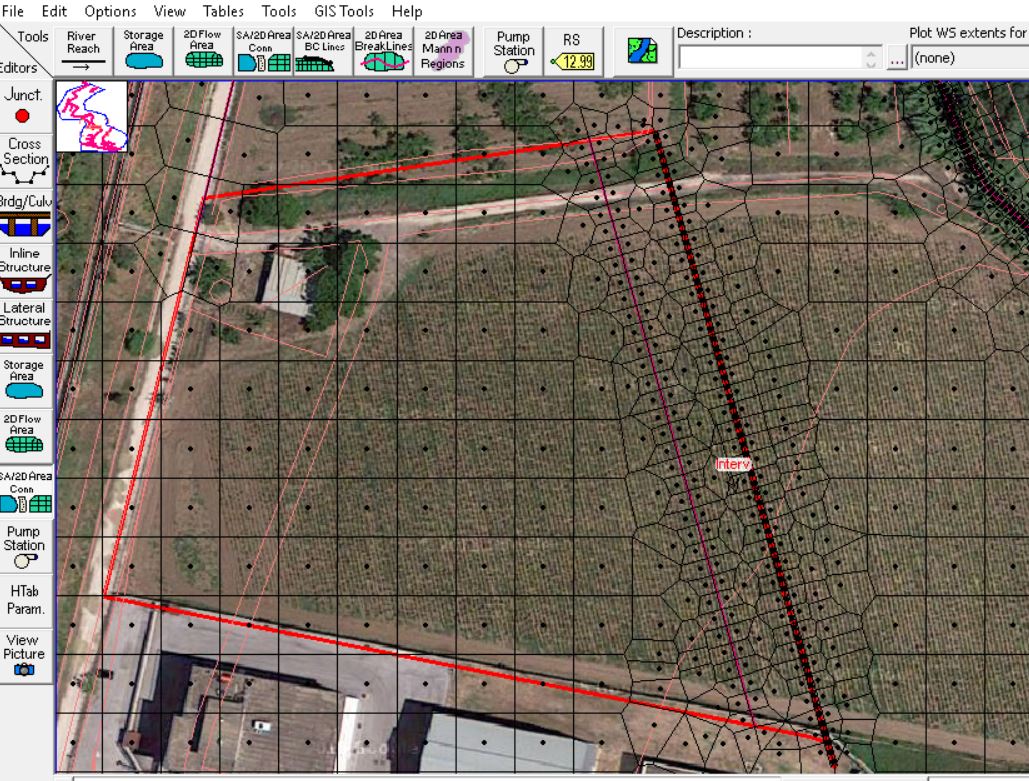
 robdirParticipant
???
item#6: “…each computational cell and cell face is based on the details of underlying terrain. This type of model is often referred to in the literature as a “high resolution subgrid model (Casulli,2008) ”
I didn’t understand your observation. I know that the cells are used to create to develop detailed hydraulic property tables, but I would like understand the method used by the program to evaluate cell center points.
If I look at pag.3.13 of 2D Modeling User’s Manual I read that HECRAS makes the computational mesh by following the Delaunay Triangulation technique, etc…
I remember that this method was used to interpolate the height of points, isn’t it?However, my request was about two “simple” questions:
1) How are located the cell center points?
2) What is the elevation associated to each cell center point?robdirParticipantI did it jarvus, but I didn’t understand how HECRAS “catched the points of Delaunay triangulation. I supposed that the black points in fig.3.9 represented the Elevation catched from the terrain associated but I don’t know how it works. If you suppose that your terrain has a 10m x 10 m grid size and your 2DArea has a 5mx5m grid size, which would the points be to take to reference? The program do an interpolation between the grid elevations 10x10m?
November 27, 2017 at 10:39 pm in reply to: Hydraulic Structures inside of 2D Flow Areas (Where is HW an TW??) #11050robdirParticipantLonnie, what do you mean for “the lowest connected cell”? Is it the cell with min WSE along the structure? I checked it but it doesn’t correct. I tried to search for the min elevation’s cell, but it doesn’t correspond.
I think also that we must look at face values for the structure… it’s different from cell calues calculated in the cell centers.
What do you think about it?robdirParticipantLook at pag.4.3-4.5 (Chapter 4 of 2D Modeling User’s Manual)…
Your Computation Interval should respect the Courant number (as described at pag.4.5).
If you insert breaklines along the main stream or banks you couldn’t ignore it.January 29, 2015 at 11:38 pm in reply to: Warning:”The energy equation could not be balanced…” in steady flow simulation. Any solutions? #9089robdirParticipantThis is my profile
-
AuthorPosts