Forum Replies Created
-
AuthorPosts
-
mlc3n3Participant
Ok. I see what you’re saying. The model currently uses upstream water surface elevation instead of energy grade elevation to initiate pressure flow. This is the company protocol and the AR DOT’s preference. However switching it back to energy grade elevation doesn’t change much if anything. Yes, I will try adjusting the minimum weir elevation in a reasonable manner.
Yes, there are normally requirements regarding pressure flow and freeboard. This project is a special case. The PR is replacing a small bridge that is over topped regularly. Based on the magnitude of the storm events and the site characteristics, a very long and perched bridge would be required to meet the requirements. That is out of scope for the city and DOT. So we are aiming for a “no rise.” Its complicated and ugly lol
Thank you for your insight and suggestions!
mlc3n3ParticipantHi Cameron,
Q5 is using pressure, Q10 is using weir, Q25 is using energy.
Although the Q10 is using a different equation compared to the other storm events, The downstream WSP doesn’t tie into existing conditions. The other storm events do tie in.
Is there an option I should change in general or to help the Q10?
mlc3n3ParticipantCameron,
I see what your saying! I was thinking about a general case, but your great diagram does specifically apply to my case. I will try this!
You are always very helpful!
Thank you so much!
mlc3n3ParticipantCameron,
Ok that make sense! Do you suggest moving all points of the entire x-secs? Or just the internal x-secs points under or at the bridge opening and crossing the river reach?
Your last sentence??? Lower the upstream and rise the downstream? I would think it should be the other way around?
Thanks
mlc3n3ParticipantHi Cameron,
Slope? Could you clarify?
Slope parallel to the river reach? Or slope perpendicular to river reach and parallel to road/bridge crossing?
If this was applied on the physical site are you suggesting a berm or excavation?
mlc3n3ParticipantFor this project I think that is the case. I’ve seen this type of rise in other projects different this this. But in general where the WSP cuts a corner but the rise doesn’t appear in the table. In those other projects I’ve worked around it by changing cross section locations or shapes.
Have any experience with this phenomenon happening? Any way to prevent or eliminate it?
mlc3n3ParticipantI can’t get all of the nodes to have labels right now.
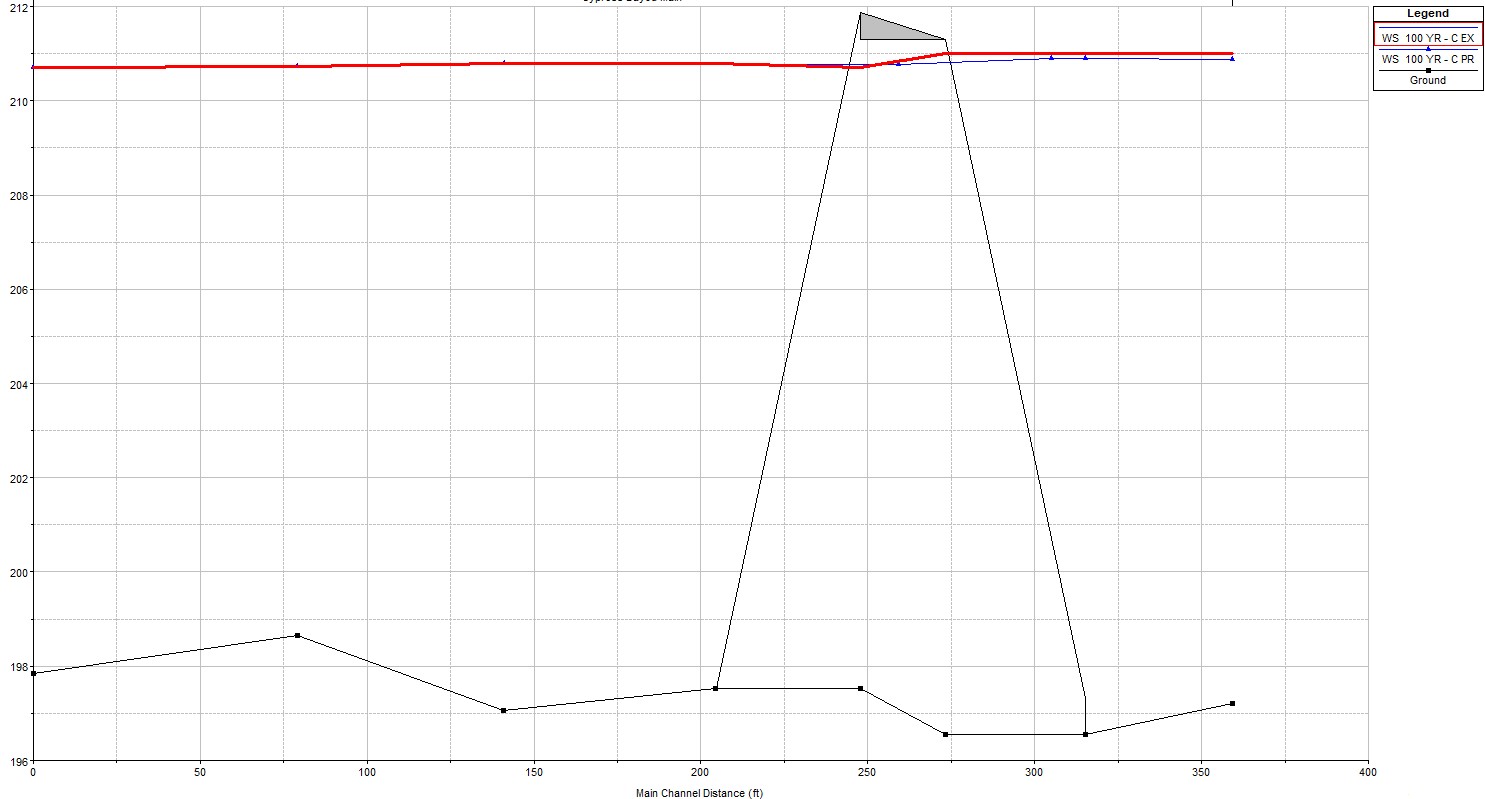
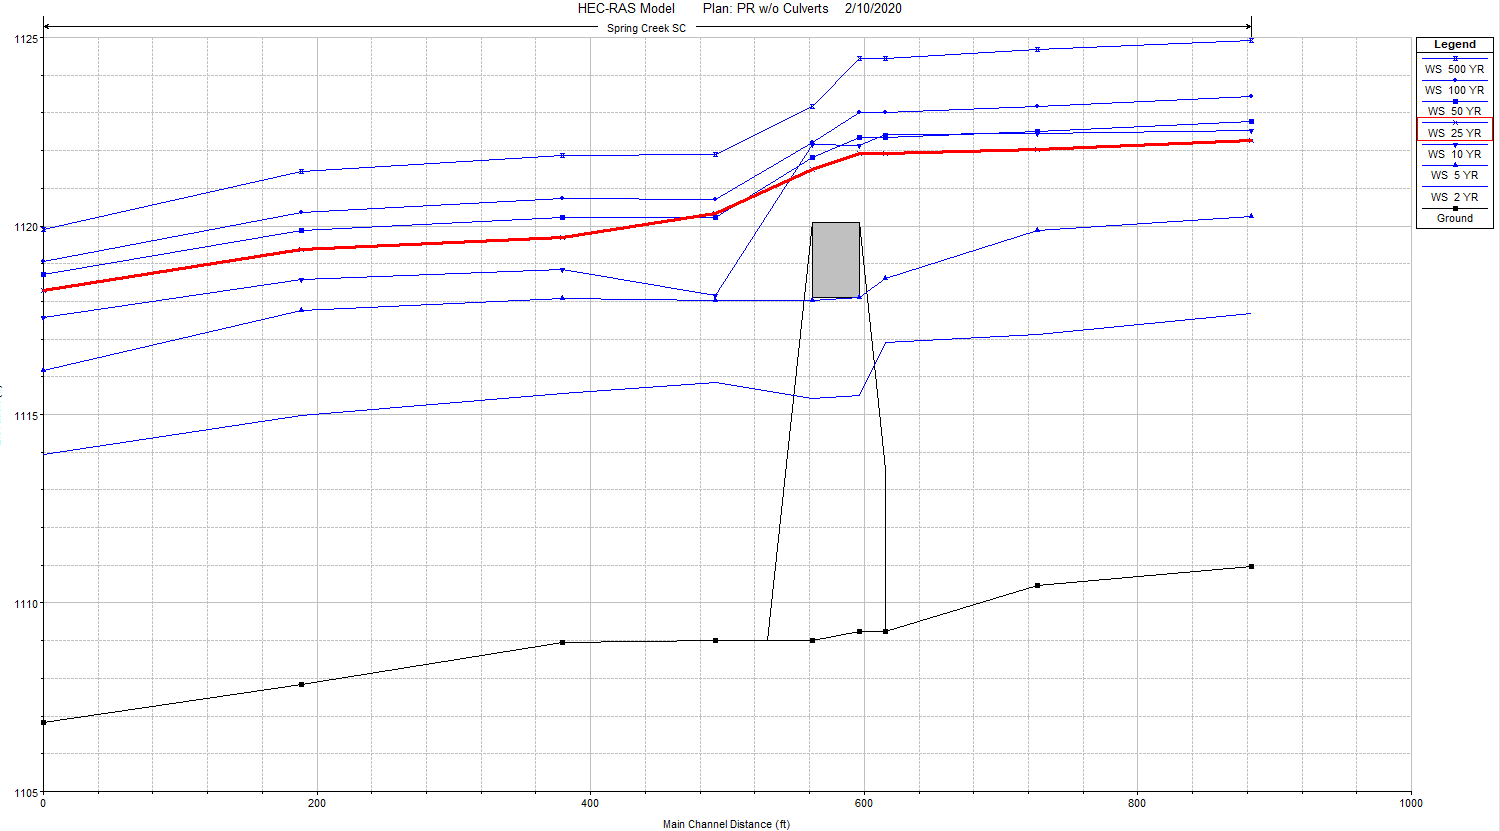
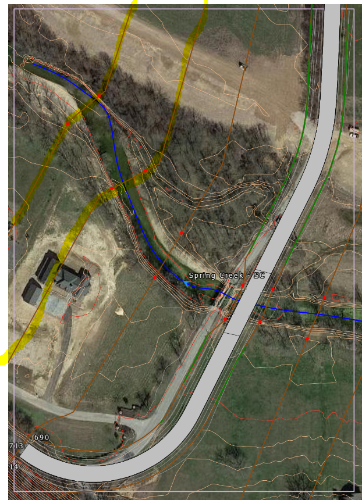
As mentioned before, the proposed (PR) WSE is below existing (EX) WSE upstream of the bridge. PR ties into EX downstream of the bridge. However in the middle the PR water surface cuts corner, per se. The behavior happens during all typical storm events. Doesn’t even show up on the summary profile table.
See below the WSP. X-secs are located at the black nodes on the bottom. The EX model has an extra x-sec so a nearest downstream x-sec isn’t too far away. Extra x-secs is at the 5th downstream node.
Hope this clarifies!
 mlc3n3Participant
Hi,
I don’t use 3D views in HECRAS so much. Could it be a setting toggled?
Maybe try examining the other result viewing options: cross-sections or profiles. The blue could be the area of the water shaded, or it could be just the top of the water surface shaded.
mlc3n3ParticipantHi,
When modeling a bridge in HECRAS, the program looks at the conveyance area under the bridge. Its more concerned with the projected area rather then the type of bridge.
In your specific case, I don’t believe you would need to do anything different. Just model the bridge how HECRAS defaults to, with 2 piers. Enter the pier dimensions as usual. After modeling, examine the bridge crossing and the internal geometry. As long as this 2D image and area looks like and represents the bridge design then the model should be fine.
Further explanation: If the actual bridge design uses hammer head piers (like in the picture), with the pier diameter or width equal to 3 ft, you can enter both the upstream and downstream piers as 3 ft in HECRAS. Looking downstream and the area under the bridge, the 2 piers in alignment in HECRAS will take up the same projected area as 1 pier from the design.
Additional, something you could experiment with is the upstream and downstream inputs for piers. You could enter the upstream inputs and perhaps leave the downstream inputs blank or zero. You could compare these results to my first suggestion.
Hope this helps!
mlc3n3ParticipantHi again.
I’m still working on the project. I have tried several solutions in order the eliminate the Q25 rise.
I tried deleting and adding the EX and PR bridges, I drew different bounding x-sec near the bridges, and I added an additional x-sec to the EX model upstream. The additional x-sec is placed in between the EX and PR bridges.All of this helped and I believe made the results more accurate. However, in the process I did fix the Q25 rise, although a similar problem developed. Now I have a 0.0118′ rise downstream of bridge (same location) but during the Q50 storm event. In an effort to fix this, I tried a combination of my same solutions with alterations, i.e. move a x-sec forward/back, small changes to bridge geometry, change bridge methodology, etc.. When trying these solution, no matter what I did, I still had a rise at the downstream bounding x-sec! And I don’t know why!
Some times the rise would be during 1 or 2 storm events; sometimes it would switch between Q50, Q25, and Q10; and the magnitude of the rise would change. At its most resent state, I was able to decrease the rise to 0.0118′, but couldn’t eliminate the rise totally. Help!
Because of the goal of “no rise” and the nature of the site, there can be no rise whatsoever at any x-sec. Any other suggestions to solve this problem?
mlc3n3ParticipantHey Cameron,
I tried toggling off the pressure/weir method for high flow. Doing this the Q25 was then above the Q10 and “in order” relative to other storm events. However the Q25 rose above the existing Q25 WSE. This deviates from the out “no rise” condition we are aiming for. Also, this only produced change over and upstream of the bridge, but not at the adjacent downstream x-sec we are concerned about. :/ bummer.
I did trying expanding the bridge and creating a larger opening. This impacted the upstream WSEs but had no change on the specific x-sec of interests. To me this means the rise could be fictitious due to the distance between the bounding x-secs (~125′). Any thoughts on that?
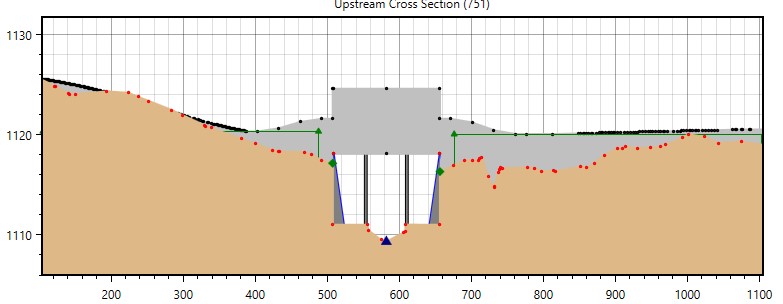
For more info on the bridge see the attached images.
You have been really helpful so far!
Any other suggestions?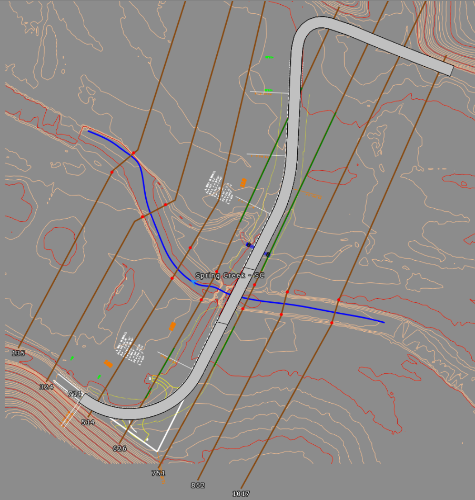
 mlc3n3Participant
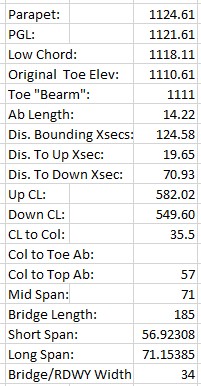
The 10yr overtops by 1.47′. The 25yr overtops by 1.73′. Overall, because of the characteristics of the project I’m not worried by the overtopping. But I did think it was odd the 10yr was above the 25yr.
The weir coefficient over the bridge is 0.8.
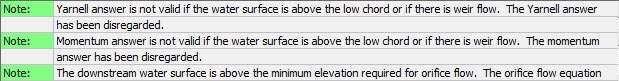
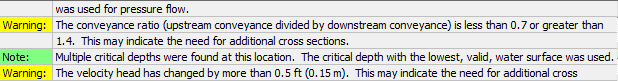
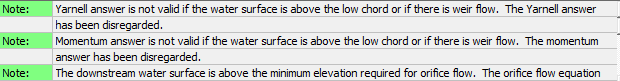
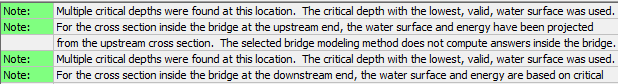
Q10 errors/warnings/notes:
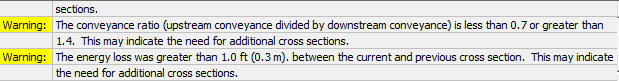
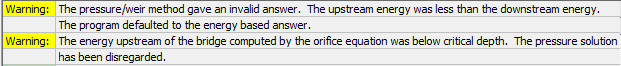
Q25 errors/warnings/notes:

 mlc3n3Participant
Hi Cameron,
Thanks for the reply!
For low flow, the model uses the highest energy from either the energy (standard step), momentum, or yarnell.
For high flow the model uses pressure and/or weir flow.I understand what you’re saying. I didn’t mention it but the bridge is over topped during storm events Q10 to Q500. When the Q10 and the Q25 overtop the bridge the WSE jsut downstream of the bridge does seem odd compared to the other larger events (Q50 to Q500). Does this provide any more insight?
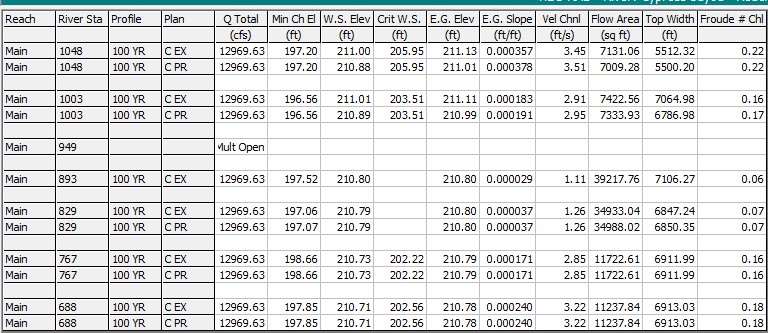
See image for more information. On the left hand side flood events are in order of magnitude from bottom increasing to the top. Q25 still highlighted in red.The blue lines are culverts from a Microstation drawing. I have two models: one including the culverts and bridge using the multiple opening analysis, and the second is without the culverts and just the bridge. In either case, I still see the rise downstream in the Q25. This bridge uses sloped abutments, therefore I haven’t tried modeling it as a large culvert. Do you recommend I try this?
Thanks!
 mlc3n3Participant
Hi Cameron,
Thank you so much for the speedy reply! This isn’t the first time you’ve helped me out!
Alright, that makes sense and clarifies things.
I’m doing some more googling. I can update if I find anything more detailed.
Thanks again!
mlc3n3ParticipantHi,
I am a new user, but I have seen some models with bridge skew.
The xsecs do need to cross the river reach perpendicular, but I understand the xsecs shouldn’t cross your bridge/culvert/roadway. In this case, I think the remaining part of the xsec could be parallel with the center line of the bridge.
Consider this model and the 2 most downstream cross sections (highlighted). I think yours could look similar.
Hope that helps!
-
AuthorPosts