Forum Replies Created

Viewing 2 posts - 1 through 2 (of 2 total)
  • Author
    Posts
  • in reply to: 2D Results Point Feature Export Question #10780
    kozskan
    Participant

    Hi Chrym,

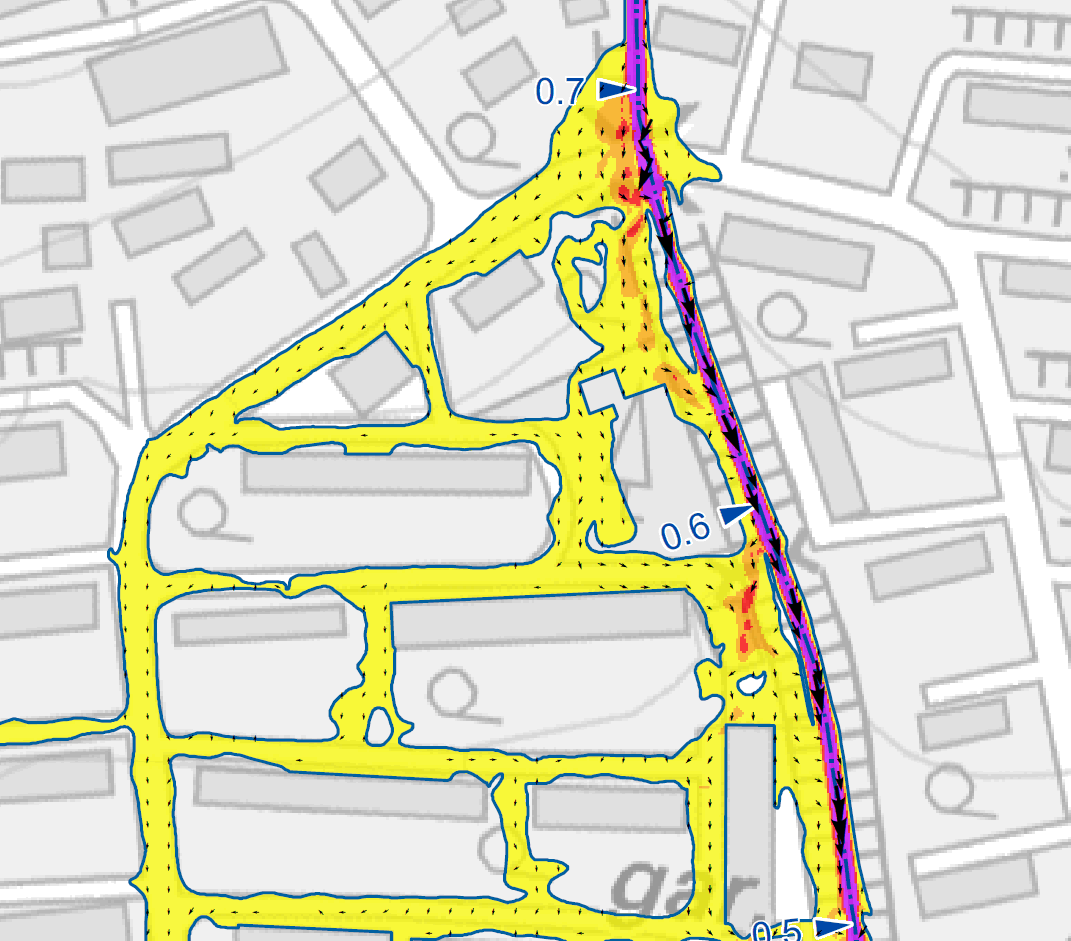
    Yes, I get the layer to the QGIS. The raster layer, where each sell was
    representing the vector of velocity and its magnitude was converted to
    points. Then I filtered small unwanted values which would mess the whole
    layout (just set a threshhold). Then QGIS, in symbology of given point layer
    you need to select the symbol (an arrow). The arrow symbol has its
    properties – magnitude and orientation and both are yeilded by hecras (you
    set it by opening the source fileld and choose the correct one in attribute
    table). The raster layer underlaying the vector layer is just the same layer
    which is stratified based on magnitude.

    in reply to: 2D Results Point Feature Export Question #10778
    kozskan
    Participant

    Hi Toby,

    I followed the discussion and I wonder if you have any clue how to create the static map of velocity arrows? I’ve extracted FacePoints Coordinate, Node X Vel and Node Y Vel in R from the HDF but I am kind of struggling with the structure of data used to create the layer that I want to use in qgis in order to create the map.

    I assume it should be mesh layer but somehow can not create it along with the vectors that represents the actual flow direction. My aim is to create a static map, similiar to wind map, where the ground would be colored based on the flow rate (m3/s) and vectors would indicate the flow direction.

    Thanks for any advice,
    PK
Viewing 2 posts - 1 through 2 (of 2 total)