Forum Replies Created
-
AuthorPosts
-
AJParticipant
I have this problem with OutputDSS_GetStageFlowSA in all 6.X versions. Did you ever figure this out? It is returning a value of 0 for nvalue (the # of hydrographs). however, I have confirmed that the hydraphs do exist. I have also tried this with several different models and have the same issue for all models. I agree that there is a problem related the new DSS version.
AJParticipantI actually removed the gate and left only the emergency spillway channel b/c I thought the gate might have something to do with it but removing it did not change the result. Thanks for the suggestion though.
AJParticipantFrom what I understand, the procedure you described using RAS Mapper only applies to manning’s n values for 2D models. It is my understanding that it will not work for assigning manning’s n values to the cross sections of a 1D model.
AJParticipantI think I need to clarify the problem, when going from ArcMap/HEC-GeoRAS to RAS (1D model) Only a single n value for all cross sections is imported even though the attributes table in ArcMap shows 9 different n values. The only value imported is the first value in the attributes table.
AJParticipantOverbank grid cell size is 5 ft. Channel grid cells size is 2-4 ft (i used breaklines to orient flow perpendicular to cell faces and to get a finer mesh in the channel up to about 800 ft from the hydraulic structure). The time step is 0.3 seconds. Courant condition showed between 0.2 to 0.4 seconds depending on cell size, I ran it 0.2 and it was not different than 0.3 so I stuck with the larger time step. I used diffusion wave because there is a constant inflow but will try the full momentum option and see if that helps.
AJParticipantThanks for the response. Why are the result in the “View DSS Data” window different than what is shown in Mapper.
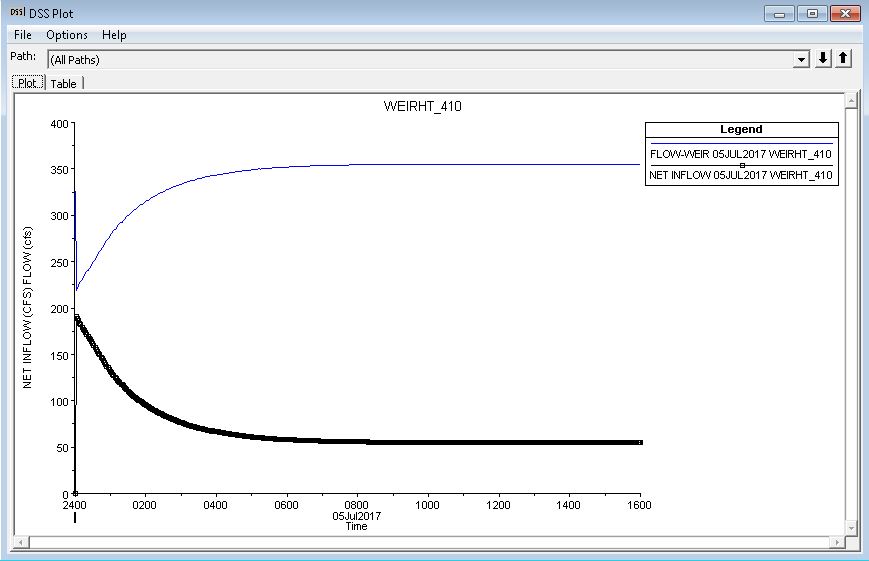
For the same example above, the inflow to the reservoir is 410 cfs. I run the model long enough to reach a steady state and the DSS results show that the weir flow is 355 cfs and the net inflow (to the reservoir) is 55 cfs, Mapper shows 420 cfs up to 100 feet from weir (started looking at mapper results at least 3 cells away form connection and up to 50 cells away) and beyond 100 feet from the weir (more than 50 cells from connection) the result in Mapper is 410 cfs.
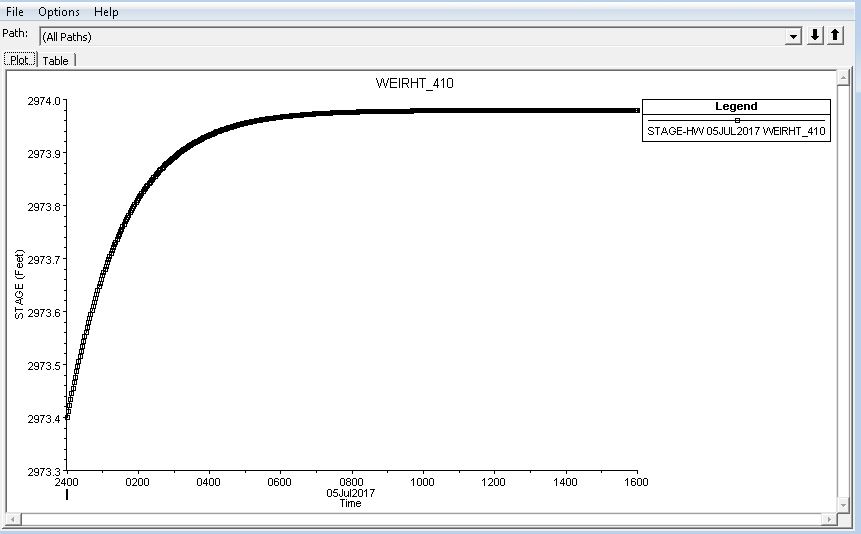
Also, the reservoir stage increases to a point and then remains constant. If there is a net inflow of 55 cfs how does the stage remain constant (there is only one outlet and one inflow to the model)? See images below for more detail
DSS Result for Net Inflow and Weir Flow
DSS Result for Stage
AJParticipantThank you for the suggestions. I tried all of them but it still shows the same result. I had read somewhere (possibly this forum) that it was a bug in the beta version but I would have thought it would be fixed by now.
AJParticipantI realize this is a late response but figured I would respond in case anyone else has these questions.
Response to question #1: Missing reach length data will occur when your XSCutLines do not intersect your Flow Paths. The cross sections must intersect at least one Flow Path on the ROB and LOB.
Response to question #2: If you already created the LandUse layer in GeoRAS, you also need to use the “Create LU Manning Table” and “Extract N Values” tools (found under RAS Geometry –> Manning’s n Values) prior to creating the export file. As far as I know, the land cover layer created in RAS Mapper only applies to the 2D area. If anyone knows of a way to get cross section manning’s n data from the layer created in RAS Mapper, please post.
AJParticipantIt depends on what you are trying to do. GIS will give you the most options. I use ArcMap so the examples I will give apply to that software but I imagine you can do similar things with other software.
I have used the following to add buildings and other solid obstructions (Arc Tool names are in bold):
Create Feature
– create the 2D (XY) surface shape (e.g., polygon)
Add Surface Information
– add shape area and elevation (Zmax)
– area information can be obtained using the Measure tool
Feature to Raster
– Convert the feature to a raster
Mosaic to New Raster
– Combine the raster you created with your terrain rasterAnother option that I have used to alter/edit raster terrains is to create a table in excel of lat, long, and elevation data for the shape you want to add. You can then import the data into Arc as a .CSV file. Once in Arc you can manipulate the data further using the Spatial Adjustment toolbar (if you have the license for it). When your satisfied with the data, create a raster of it and combine it with your terrain raster as described above. Although I have not done it, I think there is way to do this directly in RAS by importing geometry data as a .CSV file, creating a terrain from the data and merging it with your model terrain raster.
I figured out how to do the methods above by trial and error (playing with Arc Tools) and by searching forums so there are probably several other ways to manipulate raster data in GIS. If you come up with any others, please post.
AJParticipantSounds like the cross sections are not drawn in the same direction. HEC-RAS requires that the cross sections be drawn from left overbank to right overbank (facing downstream). If one was drawn right to left and the other drawn left to right, the scenario you described would happen. You can right click on the cross section that is in the wrong direction and switch direction. See post linked below:
http://hecrasmodel.blogspot.com/2008/12/criss-crossed-cross-sections.html
AJParticipantjarvus, thanks for the input.
I ran it as 2D only, and the velocity was much lower and the depth was slightly lower. the flow was also lower. however, i could not get the 2D only model to run with cell sizes small enough so that there were several cells covering the width of the channel. best i could do was a few cells wide for the channel (full momentum, time step of 2 sec, cell spacing 25×25). the model ran well though with minimal errors. I tried going with smaller cell sizes (down to 5×5 to cover the channel) and decreasing the time step but the errors were to high to be acceptable (> 1 ft).
The question now is how do I know which one is right? Do I need to do a sensitivity analysis for both models on several of the parameters to know for sure? At the down stream area of concern (where there are houses), the results are pretty similar, the difference in velocity and depth are less than 1 fps and 0.7 ft, respectively. So are both results acceptable?
On page 6-4 of the 2D Modeling User’s Manual, it is suggested that 1D may be more accurate for steep streams that are highly gravity driven with small overbank areas (this describes the upstream portion of the terrain in my model). So is the only way to determine which method to use (1D or 2D) to do both?
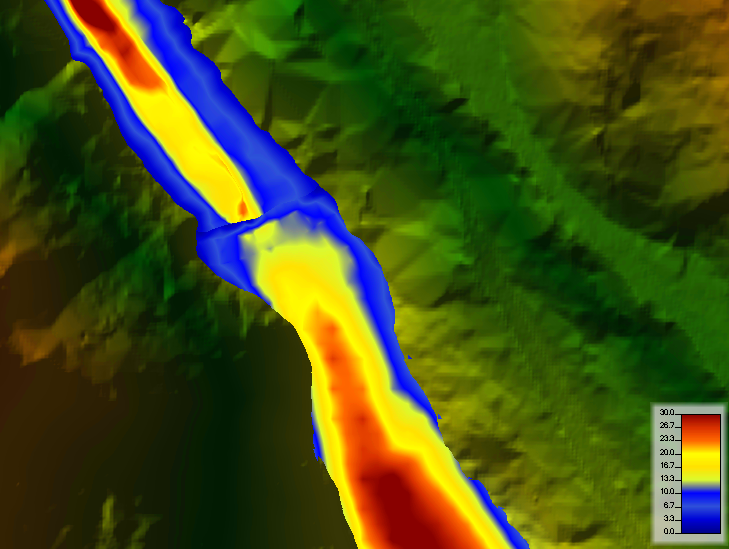
AJParticipantToby, thanks for the suggestions. I moved the boundary upstream to a more narrow section of the canyon where the flow is highly one dimensional and added more cells at the interface. The manning’s n values are the same. The result is different but does not seem to have improved (see images below). I will try a 2D only model but was under the impression that 2D should not be used in areas that are highly 1D, especially areas that have steep terrain. The channel upstream is very narrow and has steep side slopes.
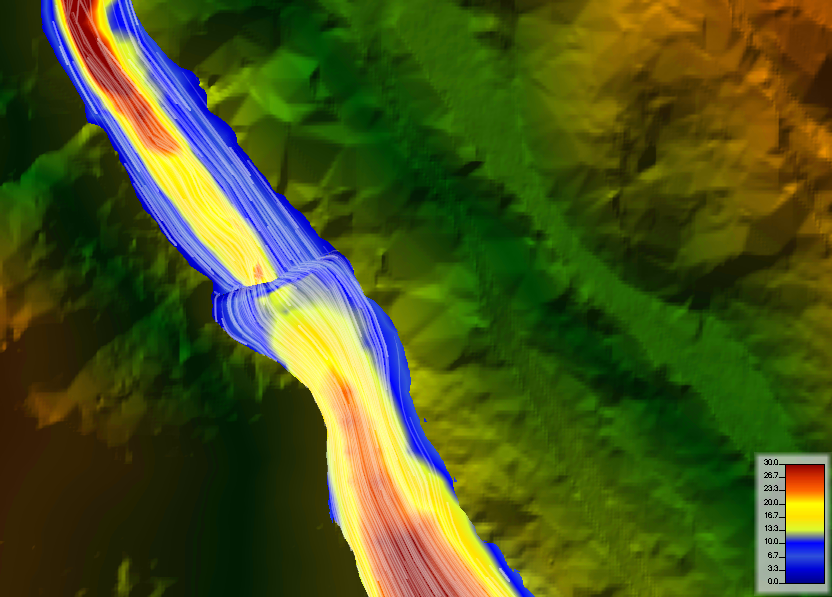
Also, the particle tracing on the velocity layer seems to indicate a break at the boundary between 1D and 2D (see image below). Any thoughts on this?
AJParticipantJarvus, thanks for the comments. The terrain data does contain the channel. I agree the uniform velocity does look a little odd but right at the connection, the terrain really opens up (gets wide and flat) very quickly so it seems reasonable.
The aspect that is concerning is that at the connection the velocity goes from 27 fps (in the 1D) down to 6 fps (at the start of the 2D) for a short distance before going back up to to 20+ fps.
When you said in your comment that the 1D/2D connection is not passing the velocity/momentum like it should, is this only with respect to the graphics for the results or do you mean that the results are not reliable?
Because the terrain goes from a very steep and narrow canyon to a relatively wide and flat area fairly quickly, I don’t think I will be able to use 1D or 2D only and the connection is just upstream of the point where the terrain widens so I don’t think I can move it either.
AJParticipantThe elevation volume curve for a storage area is cumulative. So the volume for a given elevation, is the total volume in the reservoir below that elevation.
AJParticipantI have run into this before when saving projects to a new file location. I just copied the dss file from the original folder and pasted it into the new folder. I have not had any problems with this solution.
-
AuthorPosts


