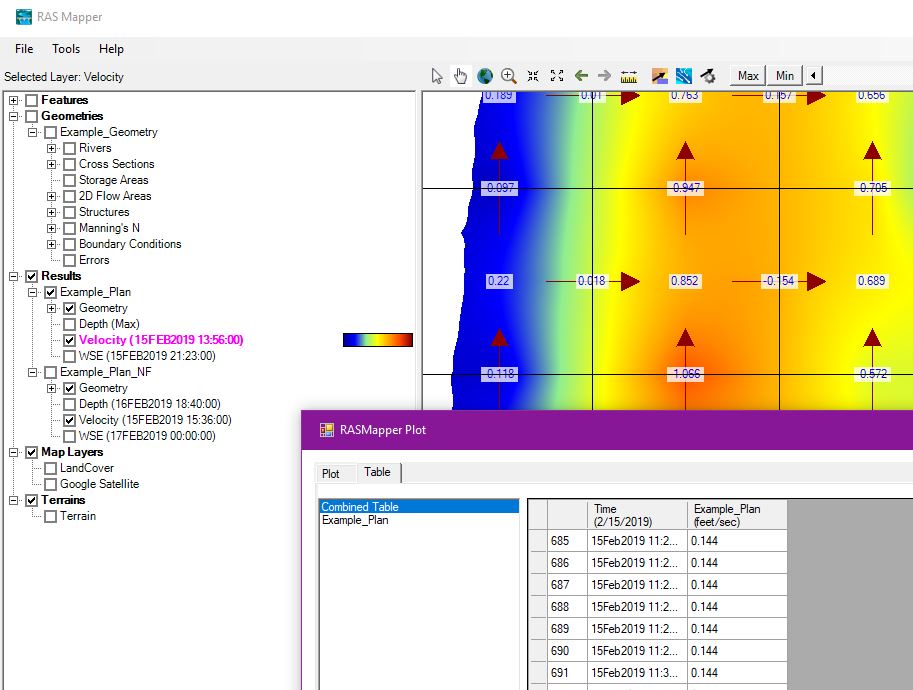
Does anyone know what the RasMapper Plot table contains. As shown in the picture below there is a combined Table and Example_plan (my simulation) tables with different values for velocity.
RasMapper can show face velocities, (also shown in the picture below) and it appears that there is a cell velocity (in the center of the cell). If this is the cell velocity, then how does one get a value of 0.852 from the four vectors (0.018, 0.154, 0.947, and 1.066) ???