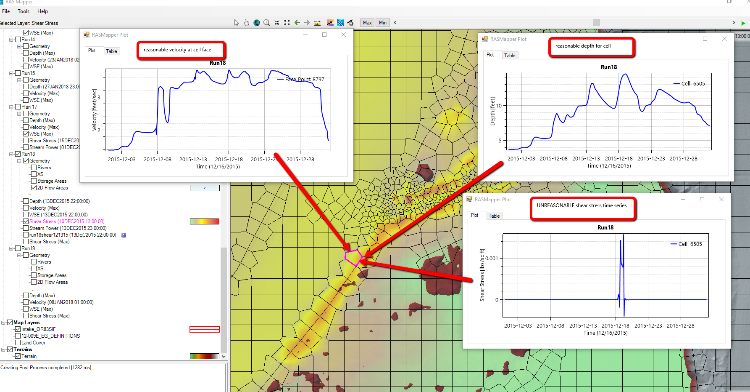
I would like to output a time series of shear stress values for a 2D model cell. My model has run just fine and shows reasonable values of shear stress in the map view. However, if I right-click the cell in the RAS Mapper, and select Time Series Plots -> Cell: Shear Stress, I get a plot with unreasonable values (basically 0). This does not agree with the values that show up when I hover the cursor over the cell. The time series plots for depth and velocity work, but the shear stress gives unreasonable results.
Can anybody help me figure this out? How can I get a time series table of shear stress at a point within the model domain? What am I doing wrong?
Thanks in advance
Daniel