Hello,
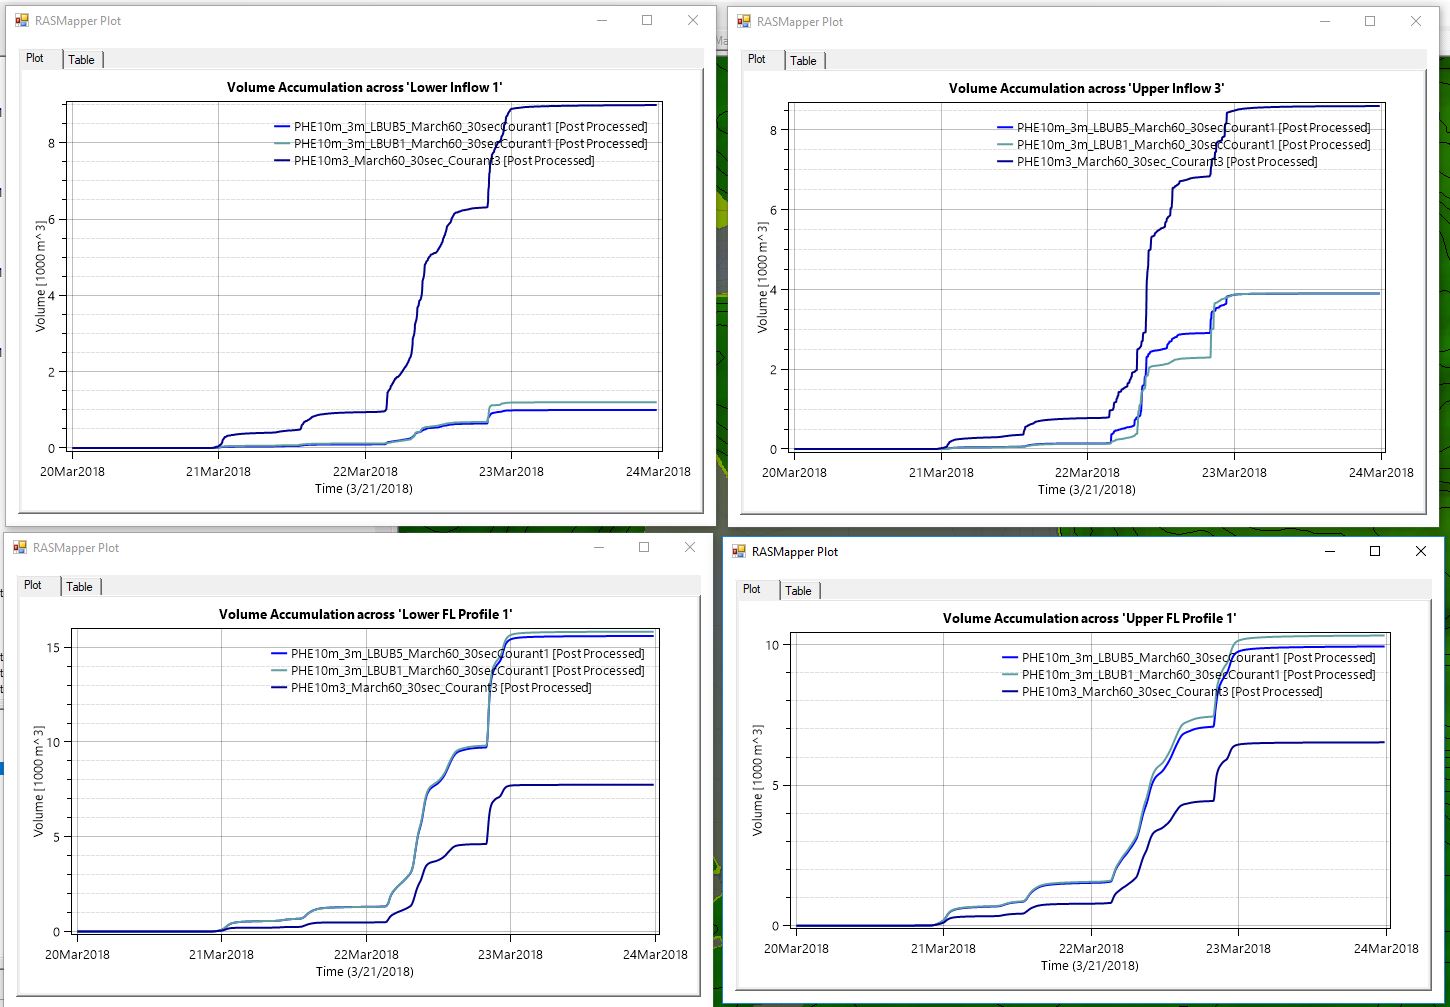
I am working on a 2D direct precipitation model to try and demonstrate restoration scenarios at my study site. I see that the DSS only outputs flow/stage conditions at my outflow boundary conditions at the bottom of my catchment. I have been using the profile lines to look at differences in accumulated volume at areas of terrain modification as well as at my outflow boundary conditions.
Is there a way to export the plots/tables from the profile lines? Or is that a manual process of copy/pasting the tables and using another program for plotting/other analysis?
Thanks
Anna