Welcome to the RAS Solution › Forums › HEC-RAS Help › Model Efficiency – 2D Culvert at Issue
- This topic has 19 replies, 1,724 voices, and was last updated 7 years, 10 months ago by Scott Miller.
-
AuthorPosts
-
April 11, 2018 at 12:06 am #6848Scott MillerParticipant
I am hoping to learn two things.
1. How fast my model should run
2. How to deal with a problematic culvertMy model is 1D/2D with about 140,000 nodes in the 2D area. Most of the nodes are dry most of the time. I added dozens of nodes to the square mesh along a stream channel and on some berms. The model is running at a 2 second time step on a computer with two true cores processing as fast as 2.7 GHz. I’ve got lateral structures iterating as many as ten times, and occasionally the transfer of flow between 2D and 1D areas does not converge below the minimum flow threshold.
It takes about an hour to simulate 24 hours. How reasonable is this?
The 2D area appears usually to iterate 11 or 12 times. I know a particular cell in the 2D area is by far the most problematic. It is on the downstream side of a 24 inch round concrete culvert (0.024). It is in very flat topography and the flow may go in either direction. The headwater and tailwater elevations do not appear to stabilize, the head alternates quickly at least during low flow, and the flow is unstable. I tried changing the size and elevations of the culvert, with no apparent affect. Would this be more of a geometry issue? How should the cells be shaped around a culvert?
April 11, 2018 at 7:34 am #11306cameronParticipantdoes the problem grid cell get a lot of depth of water or is only a small corner of it getting wet? If only a small corner is getting wet, you may need to adjust it by stretching it out (moving adjacent cells around) to allow more volume in the problem grid cell.
Not sure what the overall cell size of the model is, but a 24 hour run with a 2 second time step that takes an hour to run is not unheard of.
April 11, 2018 at 6:28 pm #11307AnonymousGuestTry selecting the drop down for “No Negative Flaps” i believe. IF this solves the issue you can resolve the issue around the impacts of the cell has on the culvert and for this i would use the worm hole technique due to the current version of RAS utilizing only 2 cell faces for computational purposes.
As for run times, 140k cells shouldnt be the question, but more so cell size. I have found more of a correlation to dt and cell size than number of cells. Of course this problem is expedited in the next version of RAS (hopefully released in the next couple weeks)
Also just to add. The width of your weir has no impact on your output. It is just a visualization tool at this point
April 11, 2018 at 7:54 pm #11308Scott MillerParticipantThank you Cameron and Luis. The base cell size in my grid is 16×16 feet. The terrain is mostly flat, but I estimate velocities of 4 to 6 feet per second are possible in some areas. I’m using the diffusion wave equation in the model. So the time step would be 5 seconds, maybe 10 seconds if the velocities peak at 3 feet per second. With the added nodes a lot of cells are about 11.3 feet on four sides. Considering Courant criteria, a 2 or 3 second time step ought to be about right. In practice, though, I settled on 2 seconds as a time step bookended by instabilities in the 2D or 1D area at shorter or longer time steps, at least at the flows with which I was ramping up the model.
I’ll have a better idea of what is going on with the problem grid cell on Friday. It’s taking 60 hours to model a 33 day period. I’ll write about what that cell is doing in 48 hours. Thanks again.
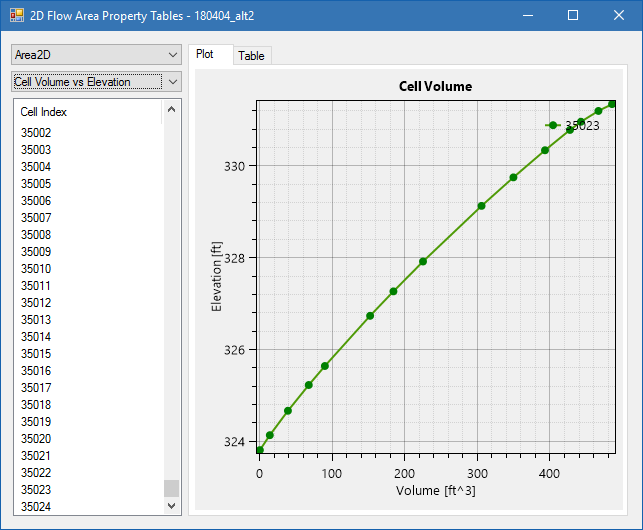
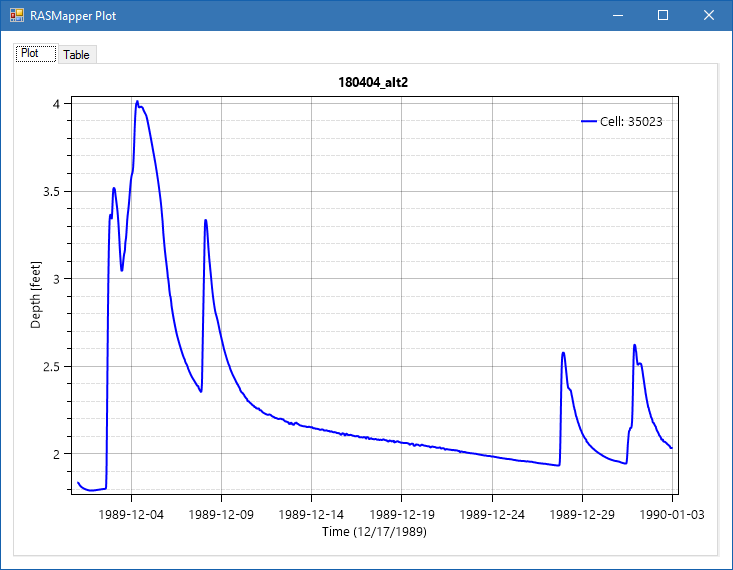
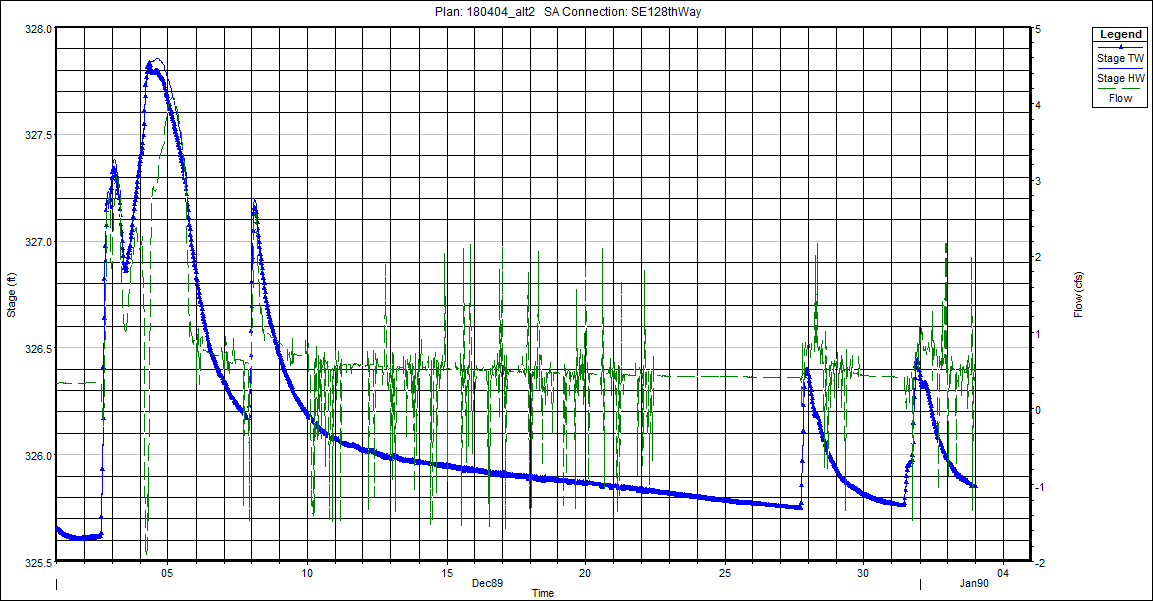
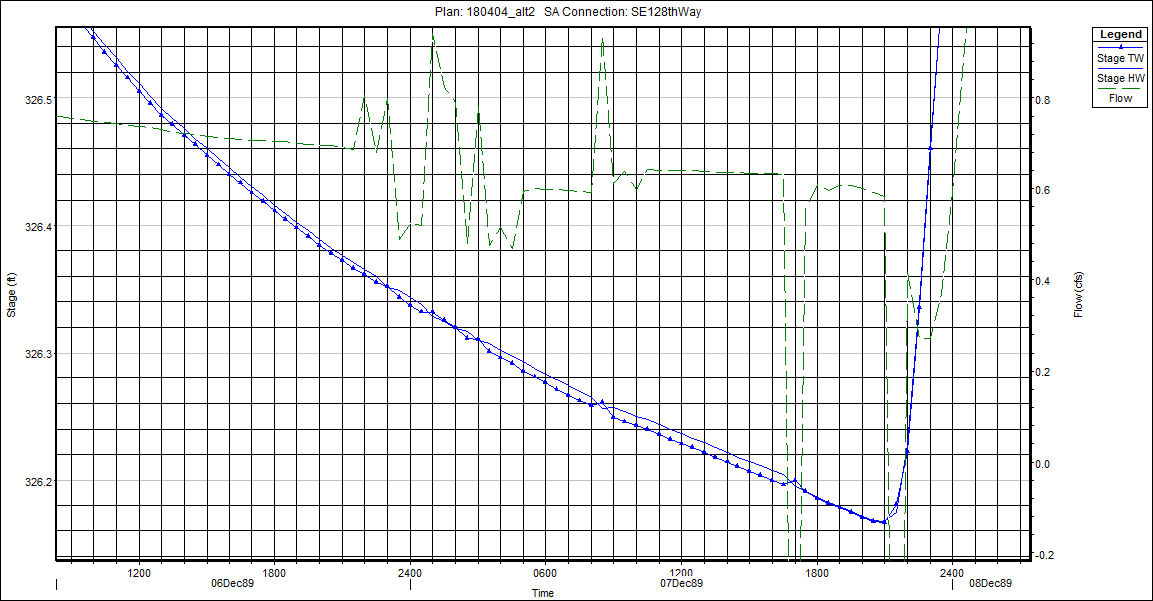
April 13, 2018 at 9:44 pm #11320Scott MillerParticipantI am including four plots in this post. Each shows characteristics of the troubled cell or 2D area connection.
1. Stage-Volume for the cell
2. Depth TS plot for the cell
3. Stage and flow hydrograph for the connection
4. A detail of the stage and flow hydrograph for the connectionThere is a uniform flow of 0.25 cfs added to the upstream area. I thought a positive flow might help the stability of culvert calculations. There are time series of inflows both upstream and downstream of the 2D area connection. It is possible for head to rise faster in the downstream area than in the upstream area.
It does not look like the volume of the cell is limiting. Only 4 feet of the 7 foot depth is used during the larger storm in this period. Maybe I misunderstand what the problem would be. Why would the cell need to be stretched?
There appears to be instability in the flow through the 2D area connection. Zooming in on the head and tail water stages reveals that the flow instability occurs when hydraulic head alternates between upstream and downstream cells.
Resolving this ought to allow the 2D area to converge in fewer iterations, and may allow a longer time step. I guess one way to deal with it would be to put a flap gate on the culvert, though there is not actually a flap gate on the culvert. Another possibility may be to disregard the hydraulics of the culvert altogether and put in a large box culvert or remove the weir and culvert altogether. I’m not sure that how that latter would affect the grid.
I’d like to see your suggestions.
April 14, 2018 at 12:53 am #11309AnonymousGuestThis is interesting. This is a suggestion for what i do when i have a problem area and the run time and or sset up time takes way too long to iteratively solve it.
You have a peak flow and hydrograph from that culvert. Yes, it has some instabilities but that can be resolved. Take the current model you have and minimize it to the problem area only so you can get run times with stability less than 5 min or so. Open up DSS and open the hydrograph for that specific culvert and manually edit the data to remove the instabilities (Its pretty simple just clicking). Once this is done copy and paste that data into excel for later use.
In your simplified model you should have only the element that is unstable. You now have a stable inflow hydrograph in excel that you can enter in and from this model iteratively get to your solution. It may be as simple as adding a max flow to your htab parameters.
April 14, 2018 at 12:58 am #11310AnonymousGuestOther suggestions, adjust max head water htab. the stage on your plot looked good enough to determine a max HW and TW so limit your max headwater htab to only like 5 ft max above the calculated one.
Is the culvert being submerged ever? Fully?
April 16, 2018 at 10:38 pm #11311Scott MillerParticipantThank you, Luis. I could definitely adjust the max heads down. I set them to accommodate overtopping the roadway, but overtopping is not likely to happen as long as the culvert is free flowing. Tighter curves may throttle down the flow instability.
I like the idea of isolating the problem and modeling it separately, but not in this case. A downstream control may backwater the culvert. Channel slope in this area is about 0.0015. That is surely part of the problem. Head difference is small, so there are likely pockets in the flow curves that defy convergence. Adjusting the maximum heads ought to help. I anticipate trying this late this week.
August 30, 2018 at 5:34 am #11312KenParticipantHave you succeeded in building a gate for your 2D culvert?
If so, I hope you guide me.
I can’t solve the 2D culvert cover gate now.August 30, 2018 at 7:56 pm #11313Scott MillerParticipantHi Ken. I did not put a gate in. The effect of valley storage affects downstream alternatives, and there is a back flow up to 4 cfs at this culvert at times.
I did make the mesh cells on either side of the connections much larger and tighten down the HTAB parameters – max. w.s. elevations. Then I focused on other things. (I did also specify the culvert center line after 5.0.4 came out.)
Going back to the connection hydrographs, and having run the model using full momentum, the flows and elevations are stable. Actually, developing a restart file using dynamic wave took longer to converge, and it may have been because of this culvert. I’ll test that.
So, I’ve got a question. Where did the dialog box (window) to set the maximum water surface elevations go?? I cannot find it in 5.0.5.
August 30, 2018 at 8:51 pm #11314AnonymousGuestScott i just found this a week ago because a coworker spotted it. HEC-RAS has HID THE TABLE FROM US.
Its now buried in the geometry data editor>tables>Htab internal boundaries
This is especially important that modelers be aware of this because of its effectiveness of stabilizing the stage and sometimes Q at a culvert in a full 2D model. Hope this helps.
August 30, 2018 at 9:57 pm #11315AnonymousGuestLuis,
I thought the maximum headwater was only used for creating the Internal Boundary curves for the culvert and that a culvert inside of 2D area didn’t use them and that is why the maximum headwater was removed.
Have you found that changing the headwater maximum changes your results for a 2D culvert?
August 30, 2018 at 10:04 pm #11321AnonymousGuestGoing back to the original problem:
Culverts inside of 2D areas appear to be more stable if the cell that the inlet is in, and the cell that the outlet is in, are bigger.
A bigger cell means that for a given flow coming in (culvert flow multiplied by time step) the water surface in the cell doesn’t change as much. So it reduces the oscillation that the original post talked about.
Also, for low flow conditions, you want the inlet cell and the outlet cell to contain more of the channel.
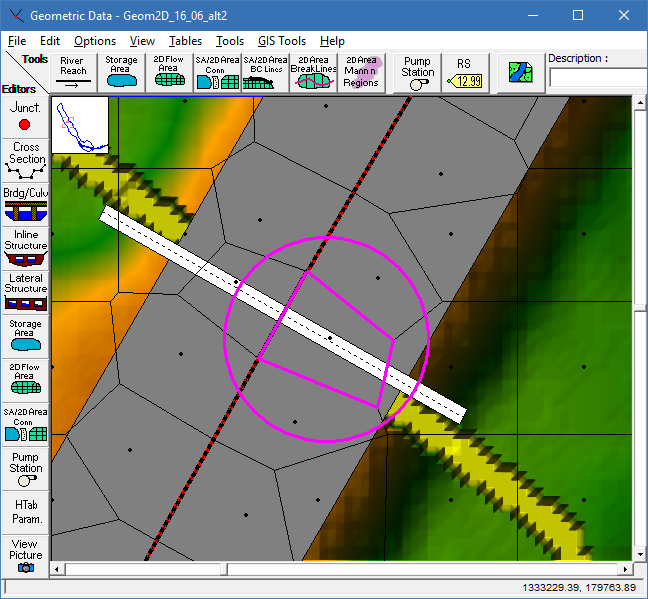
In the picture at the very top, it looks like the inlet cell only has a tiny part of the channel in the corner. If the flow was entirely down in the channel, this cell wouldn’t have as much volume compared to if the channel ran through the center of the cell.August 31, 2018 at 5:42 am #11322cameronParticipantbesides what Jarvus has said, I have also found that the diffusion wave solver gives way more stable results than full momentum for 2D culverts.
August 31, 2018 at 4:23 pm #11316AnonymousGuestJarvus,
The first post was when version 5.0.3 was the only RAS out and those Htab Parameters Definately stabilized culverts especially when Q was stable but Stage had variance.
Either way in 1D or 2D, maxing out your htab parameters help stabilize structures. Whether its only the internal boundary curve, the curve is a graphical representation for the iterative solutions that can occur. By maxing them out and applying a maximum HW you are helping the software throw out erroneous solutions
-
AuthorPosts
- You must be logged in to reply to this topic.
