Hi,
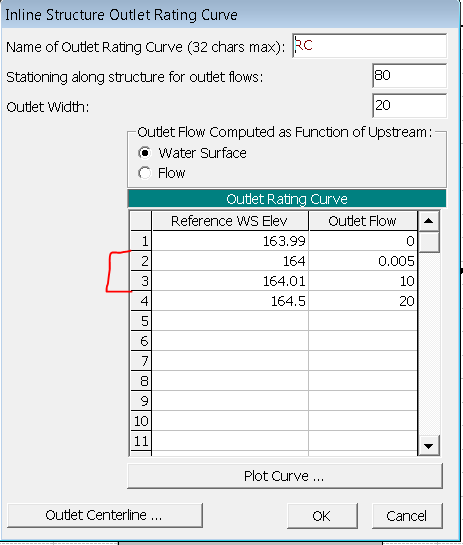
I’m working with 1d hydraulic model with cascade of small reservoirs and dams. My intention was to keep water level upstream the dams at particular levels so I defined rating curves for each of the inline structures. To do that I used Outlet RC option. Looking on the longitudinal profile they work fine – water levels upstream the dams are at the level I expected.
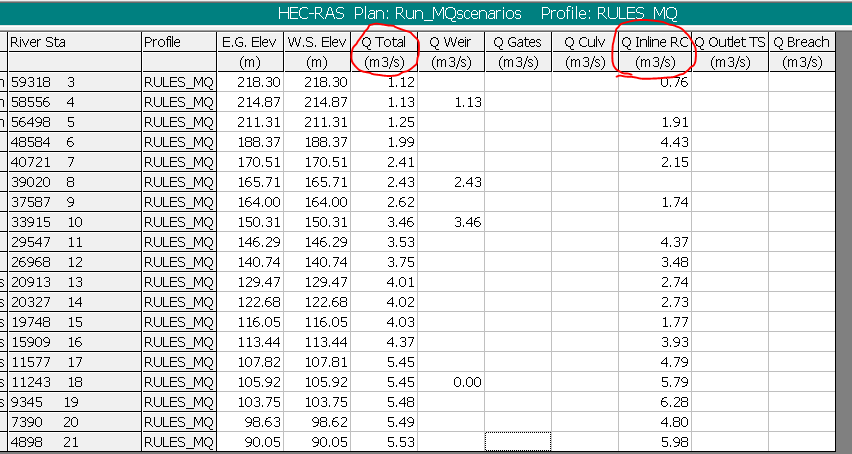
The thing is that when I started to analyse Inline Structure Output in the table view I noticed difference between Q total (which is total flow in cross-section) and Q inline RC (inline outlet rating curve flow).
Does anyone know what describes that ‘Q inline RC’ result ? Is it value interpolated from RC or what? If yes, why it is not the same as flow in the cross-section (Q total)?
I’m attaching one example of rating curves I described with ‘forced’ water level between 164,00 – 164,01 m for range of flows between 0,005-10 m3/s. My flow at this dam is 2,60 m3/s, so calculated water level is 164,00 m. I’m attaching also the table with standard table result for inline structures.
Thanks in advance for any feedback and discussion!