Thanks for the response. Why are the result in the “View DSS Data” window different than what is shown in Mapper.
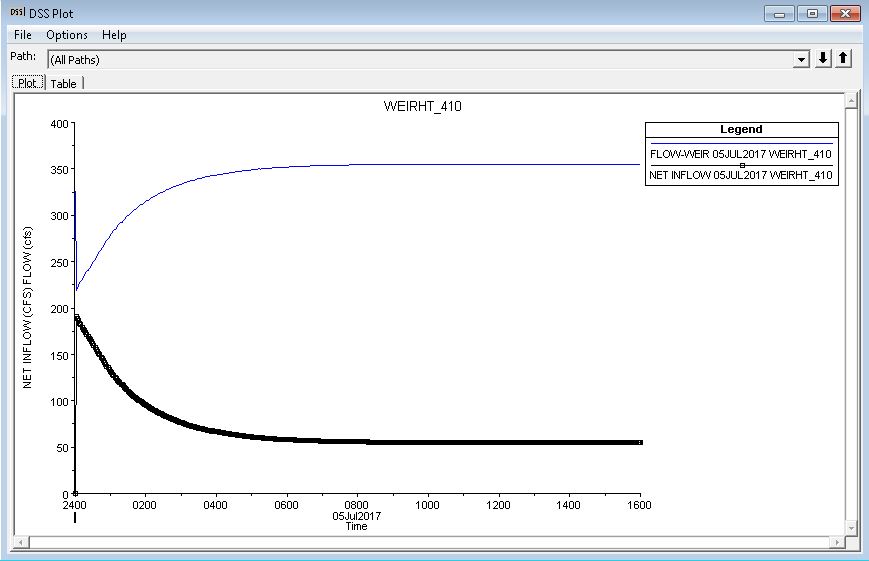
For the same example above, the inflow to the reservoir is 410 cfs. I run the model long enough to reach a steady state and the DSS results show that the weir flow is 355 cfs and the net inflow (to the reservoir) is 55 cfs, Mapper shows 420 cfs up to 100 feet from weir (started looking at mapper results at least 3 cells away form connection and up to 50 cells away) and beyond 100 feet from the weir (more than 50 cells from connection) the result in Mapper is 410 cfs.
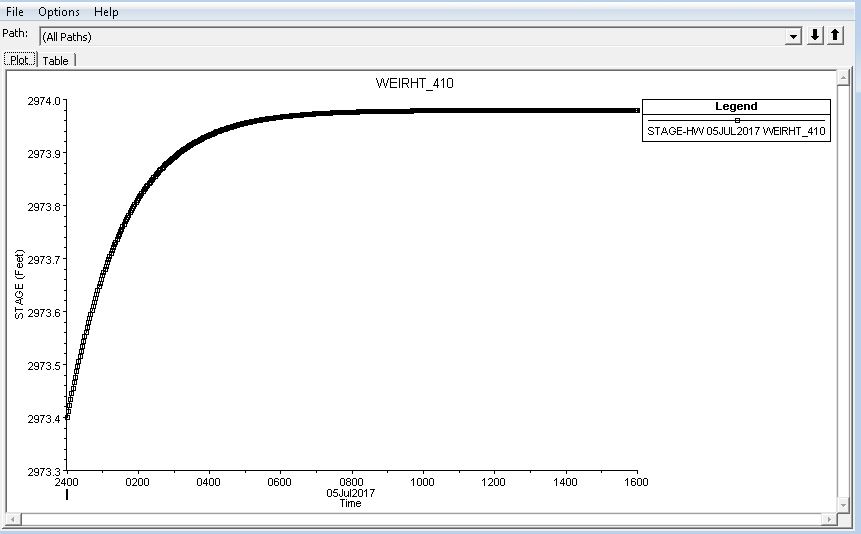
Also, the reservoir stage increases to a point and then remains constant. If there is a net inflow of 55 cfs how does the stage remain constant (there is only one outlet and one inflow to the model)? See images below for more detail
DSS Result for Net Inflow and Weir Flow
DSS Result for Stage

