Welcome to the RAS Solution › Forums › HEC-RAS Help › HEC-RAS Data Input Format (River Flow and Sediment Transport)
- This topic has 1 reply, 101 voices, and was last updated 6 years, 10 months ago by jmrsalonga.
-
AuthorPosts
-
May 2, 2019 at 11:36 am #7277jmrsalongaParticipant
Greetings, everyone! 🙂
I am currently taking Water Resources Management for BS Civil Engineering program, and we are taught to use HEC-RAS to run river flow simulations for various river set-ups and characteristics (steady, unsteady, etc). The software is pretty much straightforward and I am having fun learning how to use all of its tools.
However, one tricky part is analyzing data inputs. Our professor gave us some clear instructions for the first few river flow problems, but I am clueless about this latest one. I assume this one is taken out of some file type that the software can read directly. Unfortunately, this is all I have and I just need to know what the symbols and numbers mean. Can someone here help me out to identify what these figures mean?
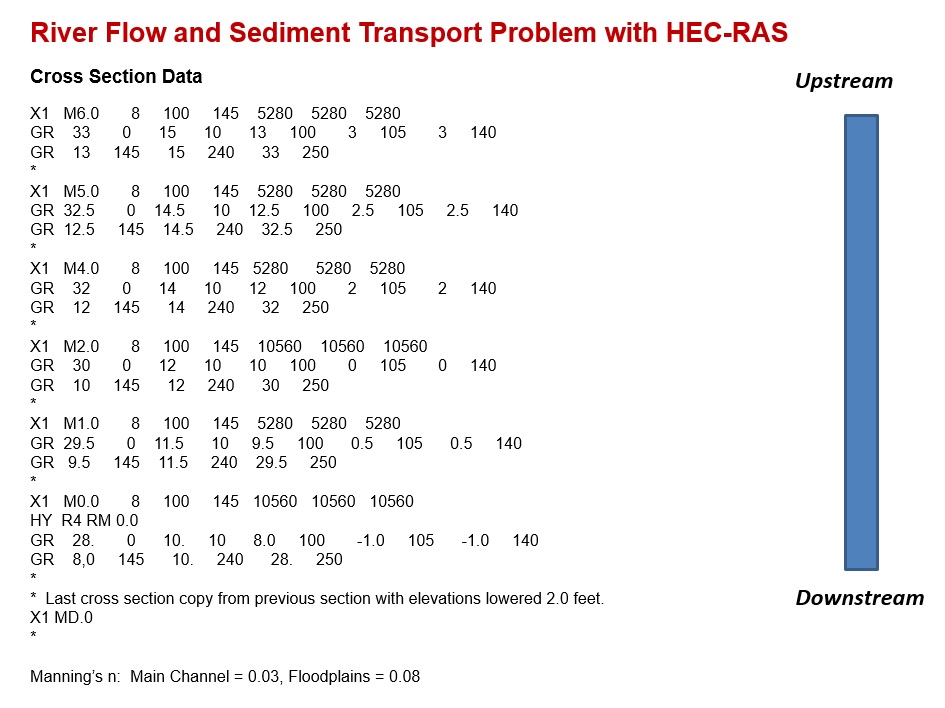
River Flow and Sediment Transport Problem with HEC-RAS
Cross Section Data
X1 M6.0 8 100 145 5280 5280 5280
GR 33 0 15 10 13 100 3 105 3 140
GR 13 145 15 240 33 250
*
X1 M5.0 8 100 145 5280 5280 5280
GR 32.5 0 14.5 10 12.5 100 2.5 105 2.5 140
GR 12.5 145 14.5 240 32.5 250
*
X1 M4.0 8 100 145 5280 5280 5280
GR 32 0 14 10 12 100 2 105 2 140
GR 12 145 14 240 32 250
*
X1 M2.0 8 100 145 10560 10560 10560
GR 30 0 12 10 10 100 0 105 0 140
GR 10 145 12 240 30 250
*
X1 M1.0 8 100 145 5280 5280 5280
GR 29.5 0 11.5 10 9.5 100 0.5 105 0.5 140
GR 9.5 145 11.5 240 29.5 250
*
X1 M0.0 8 100 145 10560 10560 10560
HY R4 RM 0.0
GR 28. 0 10. 10 8.0 100 -1.0 105 -1.0 140
GR 8,0 145 10. 240 28. 250
*
* Last cross section copy from previous section with elevations lowered 2.0 feet.
X1 MD.0
*Manning’s n: Main Channel = 0.03, Floodplains = 0.08
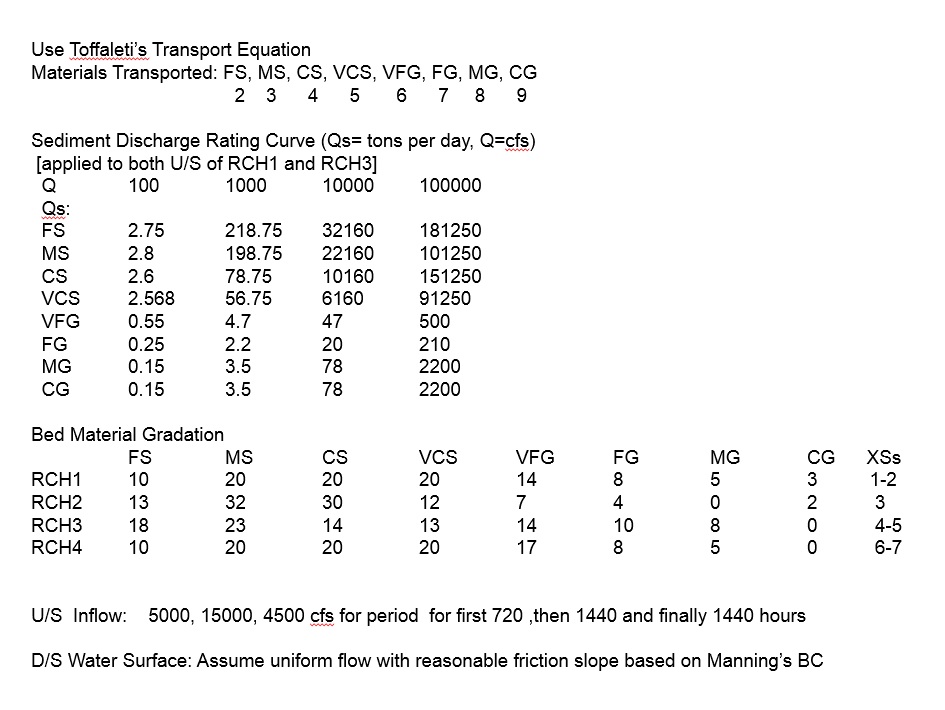
Use Toffaleti’s Transport Equation
Materials Transported: FS, MS, CS, VCS, VFG, FG, MG, CG
2 3 4 5 6 7 8 9Sediment Discharge Rating Curve (Qs= tons per day, Q=cfs)
[applied to both U/S of RCH1 and RCH3]
Q 100 1000 10000 100000
Qs:
FS 2.75 218.75 32160 181250
MS 2.8 198.75 22160 101250
CS 2.6 78.75 10160 151250
VCS 2.568 56.75 6160 91250
VFG 0.55 4.7 47 500
FG 0.25 2.2 20 210
MG 0.15 3.5 78 2200
CG 0.15 3.5 78 2200Bed Material Gradation
FS MS CS VCS VFG FG MG CG XSs
RCH1 10 20 20 20 14 8 5 3 1-2
RCH2 13 32 30 12 7 4 0 2 3
RCH3 18 23 14 13 14 10 8 0 4-5
RCH4 10 20 20 20 17 8 5 0 6-7U/S Inflow: 5000, 15000, 4500 cfs for period for first 720 ,then 1440 and finally 1440 hours
D/S Water Surface: Assume uniform flow with reasonable friction slope based on Manning’s BC
For the second part, I already distinguished the FS, MS, CS, and VCS as the soil texture classifications, but I have no idea what the other numbers mean.
I’d really appreciate anyone who can guide me out here. Once I know what these values stand for, I can easily proceed with running the simulation. Thank you so much in advance, and I hope to learn more about the experts from here! 🙂
 May 2, 2019 at 9:37 pm #12195AnonymousGuest
That looks like a HEC6 text file. HEC6 is an old sediment transport program that was replaced by HECRAS.
I’m a little surprised your instructor is trying to make you deal with that. You might see if you can find a HEC6 manual online somewhere.
*
X1 M5.0 8 100 145 5280 5280 5280
GR 32.5 0 14.5 10 12.5 100 2.5 105 2.5 140
GR 12.5 145 14.5 240 32.5 250
*The ‘X1’ stands for cross section. So that is cross section M5.0. I don’t know what the ‘8’ is. The ‘100’ and ‘145’ are probably left and right channel station. The 5280 are the lengths of the overbank and the channel. The next two lines are the station/elevation data for the cross section.
Sediment Discharge Rating Curve (Qs= tons per day, Q=cfs)
[applied to both U/S of RCH1 and RCH3]
Q 100 1000 10000 100000
Qs:
FS 2.75 218.75 32160 181250
MS 2.8 198.75 22160 101250
CS 2.6 78.75 10160 151250This looks like the upstream sediment boundary. So, for instance, if the flow was ‘1000’ cfs there would be 218.75 tons/day of Fine Sand.
Good luck.
-
AuthorPosts
- You must be logged in to reply to this topic.