Welcome to the RAS Solution › Forums › HEC-RAS Help › Full 2D – Large stage error at calibration gauge.
- This topic has 5 replies, 351 voices, and was last updated 6 years, 8 months ago by davmorr.
-
AuthorPosts
-
June 6, 2019 at 8:19 pm #7321davmorrParticipant
Hi all,
First time poster here – I am modelling 2 rivers in full 2D (unsteady flow) and having difficulty with calibration.
Model Details:
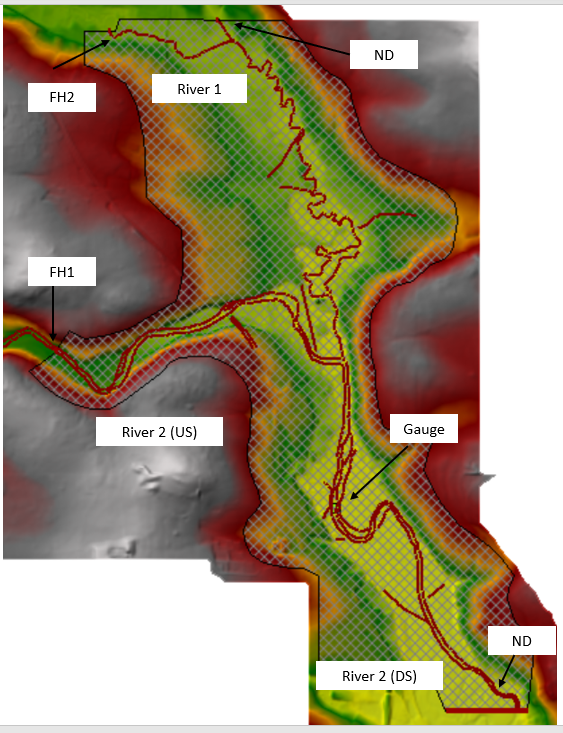
River 1 is approx. 8km, and the other (tributary) joins River 2 around half way downstream and is approx 6km. My boundary conditions are both flow hydrographs upstream of the model, and normal depth downstream (0.001). I also have a normal depth boundary close to the upstream boundary of reach 2 to allow water to exit the floodplain so as to mitigate storage. See attached image for model illustration.
My nominal grid size is 20×20, with a series of breaklines ranging from 5 – 10m grid cells to capture roads, river banks etc. The model runs stably in Full Momentum (time step controlled by Courant number, max = 1 and min= 0.45, with a base time step of 30secs), volume percent error is 0.002.
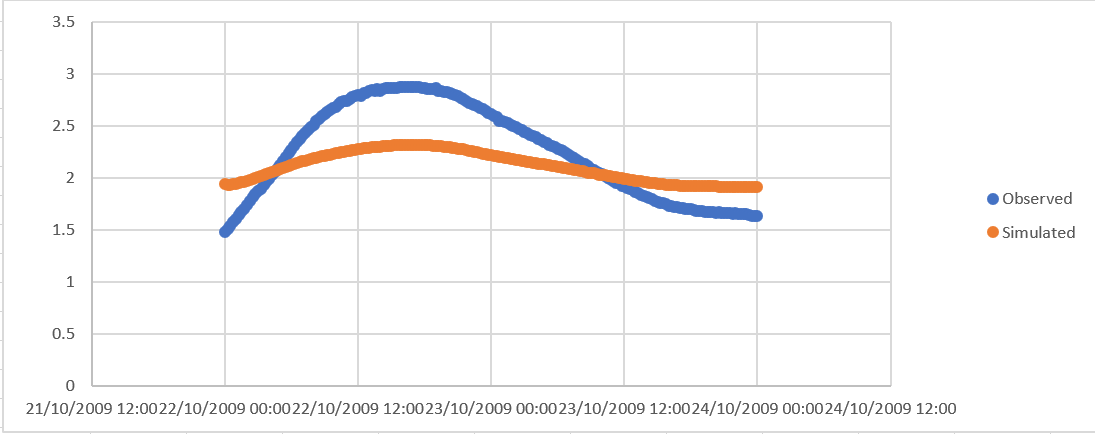
There is a water level gauge located in the lower reach of river 1, which acts as my calibration gauge. When I run my unsteady model as per the time series (15min interval) data i have for my flow hydrographs (time series data from known gauges), my simulated water levels are significantly off compared to observed data at the calibration gauge (see attached hydrograph). I have tried using flow multipliers at inflows to raise the level however it raises the whole hydrograph as opposed to peak only. I have adjusted Manning’s n in floodplain and channel however it negligible difference. The floodplain extents/depths have been compared with extents/depths from national flood risk maps (SEPA flood maps) and they are pretty well calibrated.
I feel like I have exhausted a lot of my options (or the obvious ones) to fix this but I’m having no luck. If anyone could help me out here it would be much appreciated. Happy to send project file if someone can be bothered looking at it in detail. Apologies in advance if I have missed out any key details in model description.
June 6, 2019 at 8:54 pm #12279davmorrParticipantJune 6, 2019 at 9:30 pm #12280Scott MillerParticipantIt may be necessary to further calibrate the hydrology so the rising limb, peak, recession, baseflow, and period volumes follow the same pattern as the observed stage. Consider modeling a longer time period, so the suitability of the hydrology is more visible.
Beyond that it looks like storage may be over-utilized – too much attenuation. What Manning n values have you tried? What flow range, channel width, and bed material are we looking at?
June 7, 2019 at 4:48 pm #12281AnonymousGuestScott,
Thanks for your reply!
I believe in both cases it is a gravel bed with some vegetation at points along the banks. Manning’s values as follows:
Channel (gravel) – 0.033
Floodplain (arable cropland/short grass) – 0.03
Trees – 0.1
Roads – 0.2
Urban 1The tributary river 1 is approx 10m wide and tightly meanders, and the main channel is 30m and is mostly straight with some gentle bends. Flow range in river 1 is 16-30m3/s and river 2 is 65-203 m3/s. Taking into account what you said about modelling a longer time period, my base flows are then dramatically lower at 2m3/s (river1) and 7m3/s (river2) until they begin to rise for the flood event. I have simulated the event beginning a few days before the flow begins to rise. There is now a better representation of the rising limb, although arrival time is slightly off. The stage is still significantly lower than the observed which I’m sure is due to storage in floodplain adjacent to the calibration gauge. I have tried to capture the terrain as best as possible using breaklines to ensure water isn’t being stored where it shouldn’t be. How else can i ensure storage isn’t over-utilised? My model seems quite insensitive to changes in overall Manning’s, and i don’t want to force calibrate but using unrealistic Manning’s values.
Kind regards,
David
June 7, 2019 at 7:23 pm #12282AnonymousGuestWhat is your simulated time step? Did you mean 15-min is your d(t) for RAS? Or you are comparing data at intervals at every 15-min.
If you are running your model at a d(t) of 15-min this is the issue. For a 20×20 grid cell i would start at 30 seconds and only go lower or higher based on results and continuity
June 7, 2019 at 7:27 pm #12283AnonymousGuestHi Luis,
My simulated timestep is 30 seconds already, with adaptive time step in place to meet Courant criteria. The 15min I refer to is my data interval.
Kind regards,
David
-
AuthorPosts
- You must be logged in to reply to this topic.


