Welcome to the RAS Solution › Forums › HEC-RAS Help › Downstream rise during one flood event
- This topic has 7 replies, 152 voices, and was last updated 6 years ago by mlc3n3.
-
AuthorPosts
-
February 10, 2020 at 9:00 pm #7603mlc3n3Participant
Hi,
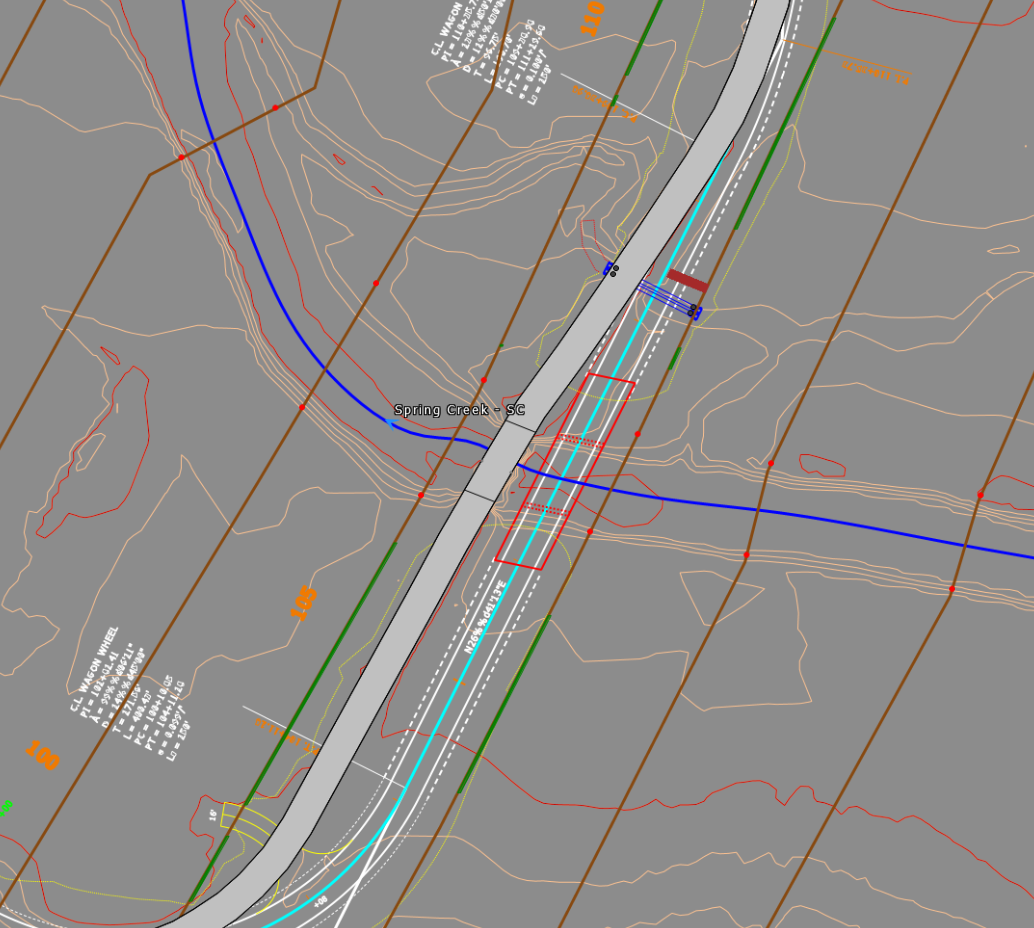
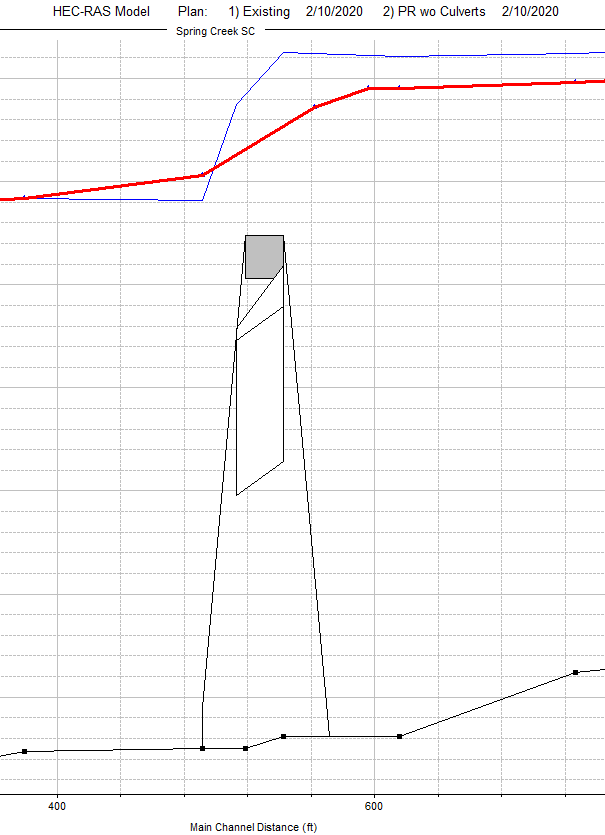
I’m modeling an existing bridge and a larger proposed bridge. The low chord of both bridges match, although the proposed is longer therefore has a larger opening area. In addition, the proposed bridge is upstream of the existing by 45′ (center line to center line). Both models have the same x-sec to compare the WSE. See attached image. (EX in gray, PR in red)
When comparing results at the x-sec just downstream of both bridges, the proposed model shows a lower WSE during all storm events but the Q25. I have about a 0.5′ rise during the Q25 storm while all other events are below existing.
Have any ideas why this could be happening? Any suggestions on what to check or what to change?
February 11, 2020 at 7:35 pm #12731cameronParticipantWhat bridge methodology is being calculated for each flow and bridge? If it transitions between low flow to high flow or energy/full momentum to pressure/weir differently at the Q25 for each bridge then you can get results similar to what you mention.
What does the blue line in the overbank represent (second opening)? If it is a second opening, are you modeling it as a multiple opening or with two culverts (one for main opening and one for secondary)?
February 11, 2020 at 7:58 pm #12732mlc3n3ParticipantHi Cameron,
Thanks for the reply!
For low flow, the model uses the highest energy from either the energy (standard step), momentum, or yarnell.
For high flow the model uses pressure and/or weir flow.I understand what you’re saying. I didn’t mention it but the bridge is over topped during storm events Q10 to Q500. When the Q10 and the Q25 overtop the bridge the WSE jsut downstream of the bridge does seem odd compared to the other larger events (Q50 to Q500). Does this provide any more insight?
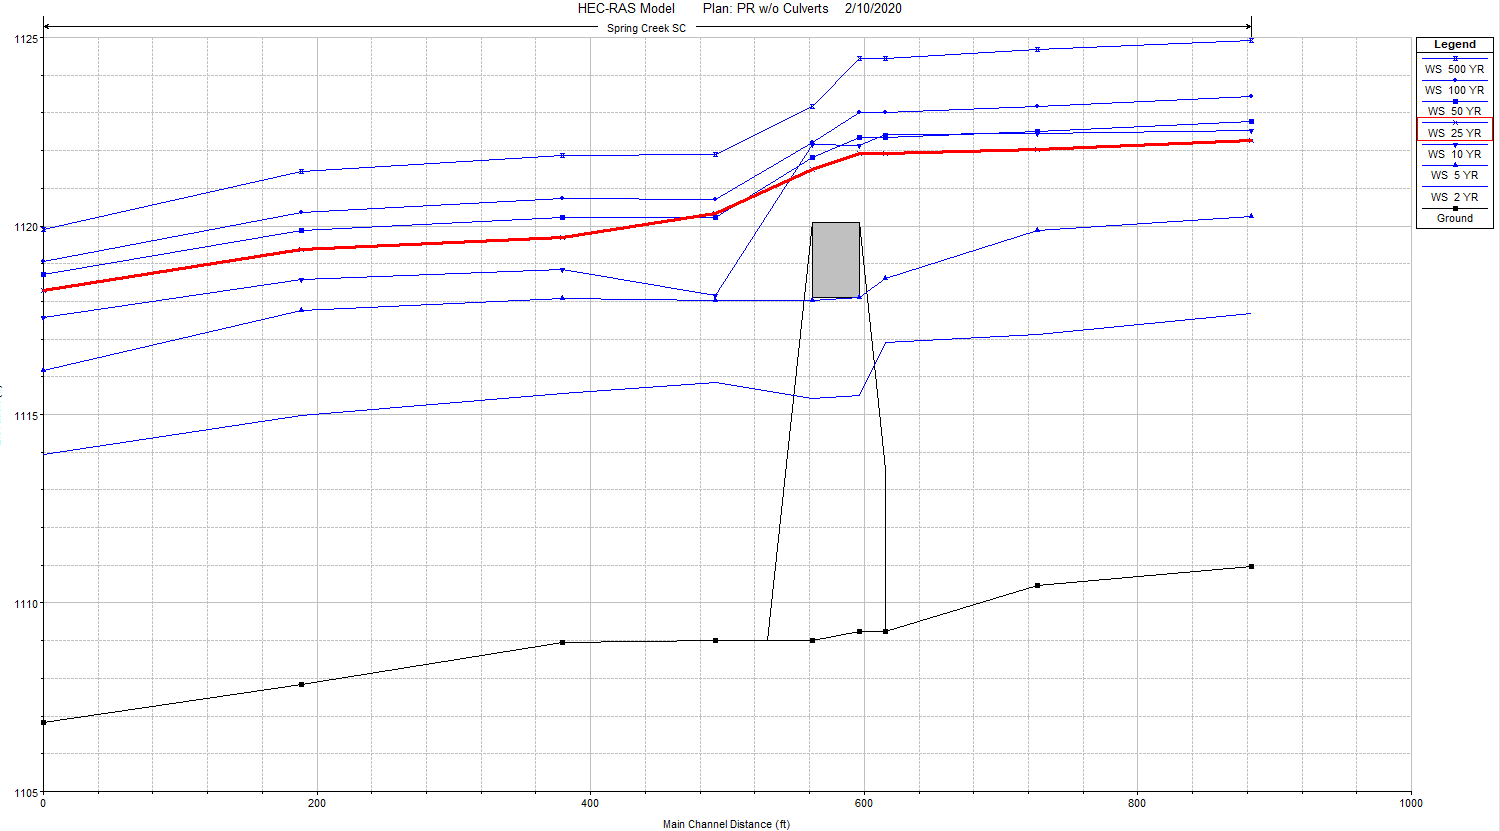
See image for more information. On the left hand side flood events are in order of magnitude from bottom increasing to the top. Q25 still highlighted in red.The blue lines are culverts from a Microstation drawing. I have two models: one including the culverts and bridge using the multiple opening analysis, and the second is without the culverts and just the bridge. In either case, I still see the rise downstream in the Q25. This bridge uses sloped abutments, therefore I haven’t tried modeling it as a large culvert. Do you recommend I try this?
February 11, 2020 at 8:19 pm #12733cameronParticipantYour 10yr event has a higher wse upstream of the bridge than the 25yr which isn’t good. It is hard to determine the actual reason without looking at your model.
By how much are they both overtopping the bridge?
Are both the 10yr and 25yr events using the pressure/weir as their solution method or is one pressure and the other doing pressure/weir?
What is your weir coefficient over the bridge?
Do you get any errors/warnings/notes for the bridge?
February 11, 2020 at 8:46 pm #12734mlc3n3ParticipantThe 10yr overtops by 1.47′. The 25yr overtops by 1.73′. Overall, because of the characteristics of the project I’m not worried by the overtopping. But I did think it was odd the 10yr was above the 25yr.
The weir coefficient over the bridge is 0.8.
Q10 errors/warnings/notes:
Q25 errors/warnings/notes:
February 12, 2020 at 6:26 pm #12735cameronParticipantThe warning message for the 10yr states it is using the energy solution and not the pressure weir. This is probably why the 25yr is below the 10yr. What are the larger events using (50yr and 100yr)? Not sure what your bridge geometry/cross-section look like and how much flow is in the overbanks, but it may be worth while to just use energy for all of them.
February 13, 2020 at 11:29 pm #12736mlc3n3ParticipantHey Cameron,
I tried toggling off the pressure/weir method for high flow. Doing this the Q25 was then above the Q10 and “in order” relative to other storm events. However the Q25 rose above the existing Q25 WSE. This deviates from the out “no rise” condition we are aiming for. Also, this only produced change over and upstream of the bridge, but not at the adjacent downstream x-sec we are concerned about. :/ bummer.
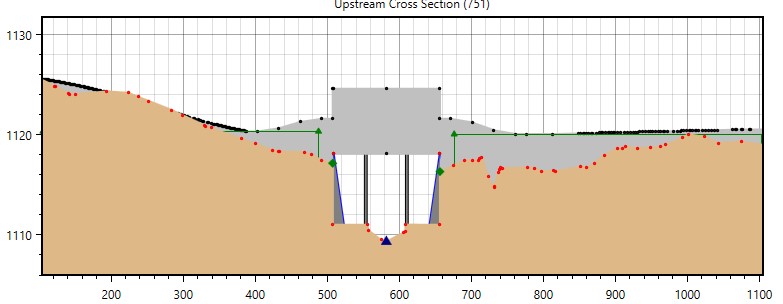
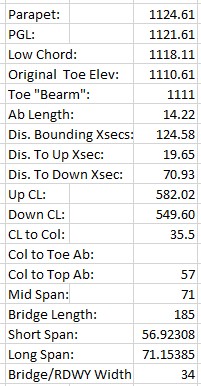
I did trying expanding the bridge and creating a larger opening. This impacted the upstream WSEs but had no change on the specific x-sec of interests. To me this means the rise could be fictitious due to the distance between the bounding x-secs (~125′). Any thoughts on that?
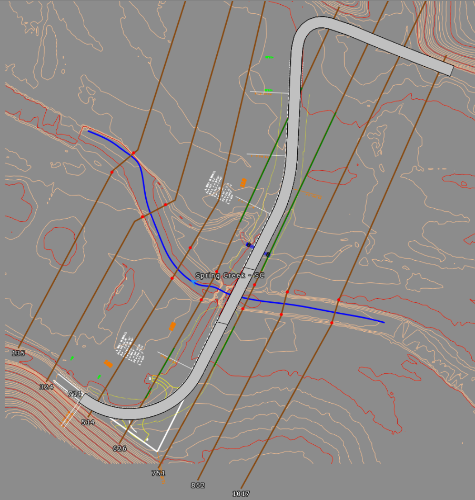
For more info on the bridge see the attached images.
February 25, 2020 at 11:39 pm #12737mlc3n3ParticipantHi again.
I’m still working on the project. I have tried several solutions in order the eliminate the Q25 rise.
I tried deleting and adding the EX and PR bridges, I drew different bounding x-sec near the bridges, and I added an additional x-sec to the EX model upstream. The additional x-sec is placed in between the EX and PR bridges.All of this helped and I believe made the results more accurate. However, in the process I did fix the Q25 rise, although a similar problem developed. Now I have a 0.0118′ rise downstream of bridge (same location) but during the Q50 storm event. In an effort to fix this, I tried a combination of my same solutions with alterations, i.e. move a x-sec forward/back, small changes to bridge geometry, change bridge methodology, etc.. When trying these solution, no matter what I did, I still had a rise at the downstream bounding x-sec! And I don’t know why!
Some times the rise would be during 1 or 2 storm events; sometimes it would switch between Q50, Q25, and Q10; and the magnitude of the rise would change. At its most resent state, I was able to decrease the rise to 0.0118′, but couldn’t eliminate the rise totally. Help!
Because of the goal of “no rise” and the nature of the site, there can be no rise whatsoever at any x-sec. Any other suggestions to solve this problem?
-
AuthorPosts
- You must be logged in to reply to this topic.
