I run a 1D-2D model containing a bridge and I am wondering what is the best modelling approach to use. I understand the conceptual difference between the energy equation and the pressure and/or weir equation but I don’t know which suits best to my situation.
I ran two simulations to compare the results. According to my 2D inundation maps, the results seem to be identical.
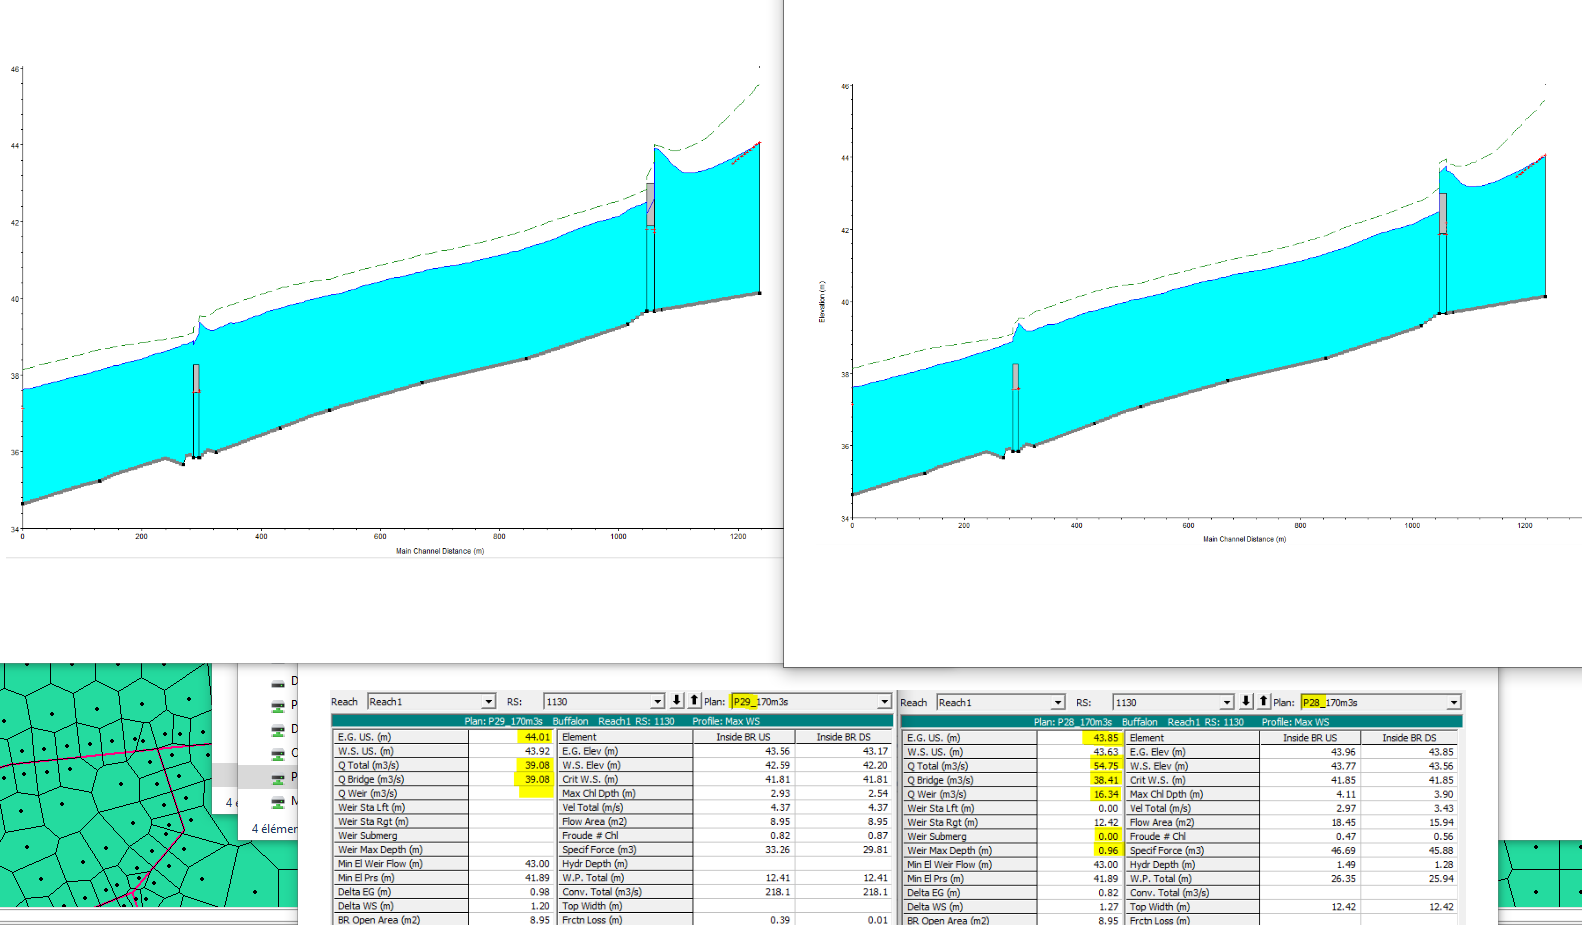
When I open the profile plots, for the standard equation the shape of WS strongly increases in the vicinity of the bridge US XS, then strongly decreases between the latter and the bridge internal US X, decreases inside of the bridge, an finally strongly increases between the bridge internal DS XS and the bridge DS XS. For the pressure and weir equation, the EG line and the WS increase even higher inside of the bridge (and water seems to accumulate over the bridge deck).
I am questioning myself about the validity of such results. In particular, I noticed the EG line is not always decreasing, which I thought was not realistic. Also the WS and EG lines transitions look very sharp to me.
I also compared he bridge tabular outputs and the results look quite different for each bridge. Most surprising is that even though the WS is much higher than the highest chord of the bridge, there is no weir flow for the standard equation. Also I am quite surprised that the total flow is so different (but I cannot see any difference in my inundation maps).
According to you are these results correct ?
On the following picture you can see on the left hand side the results for the standard equation, and on the right hand side the results for the pressure and or weir equation.
