Welcome to the RAS Solution › Forums › HEC-RAS Help › Connection 1D-2D with terrain (NO LEVEE)
- This topic has 31 replies, 2,353 voices, and was last updated 7 years, 2 months ago by SaraA.
-
AuthorPosts
-
December 5, 2018 at 1:30 pm #11938SaraAParticipant
Hi Scott and Luis,
I tried to follow your indications, Scott; but I have some doubts.
I will explain you step by step what I did with images:
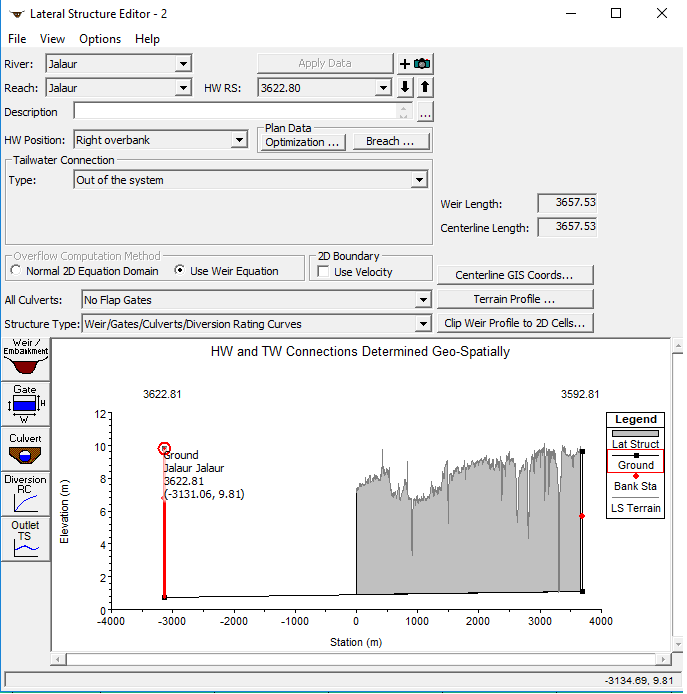
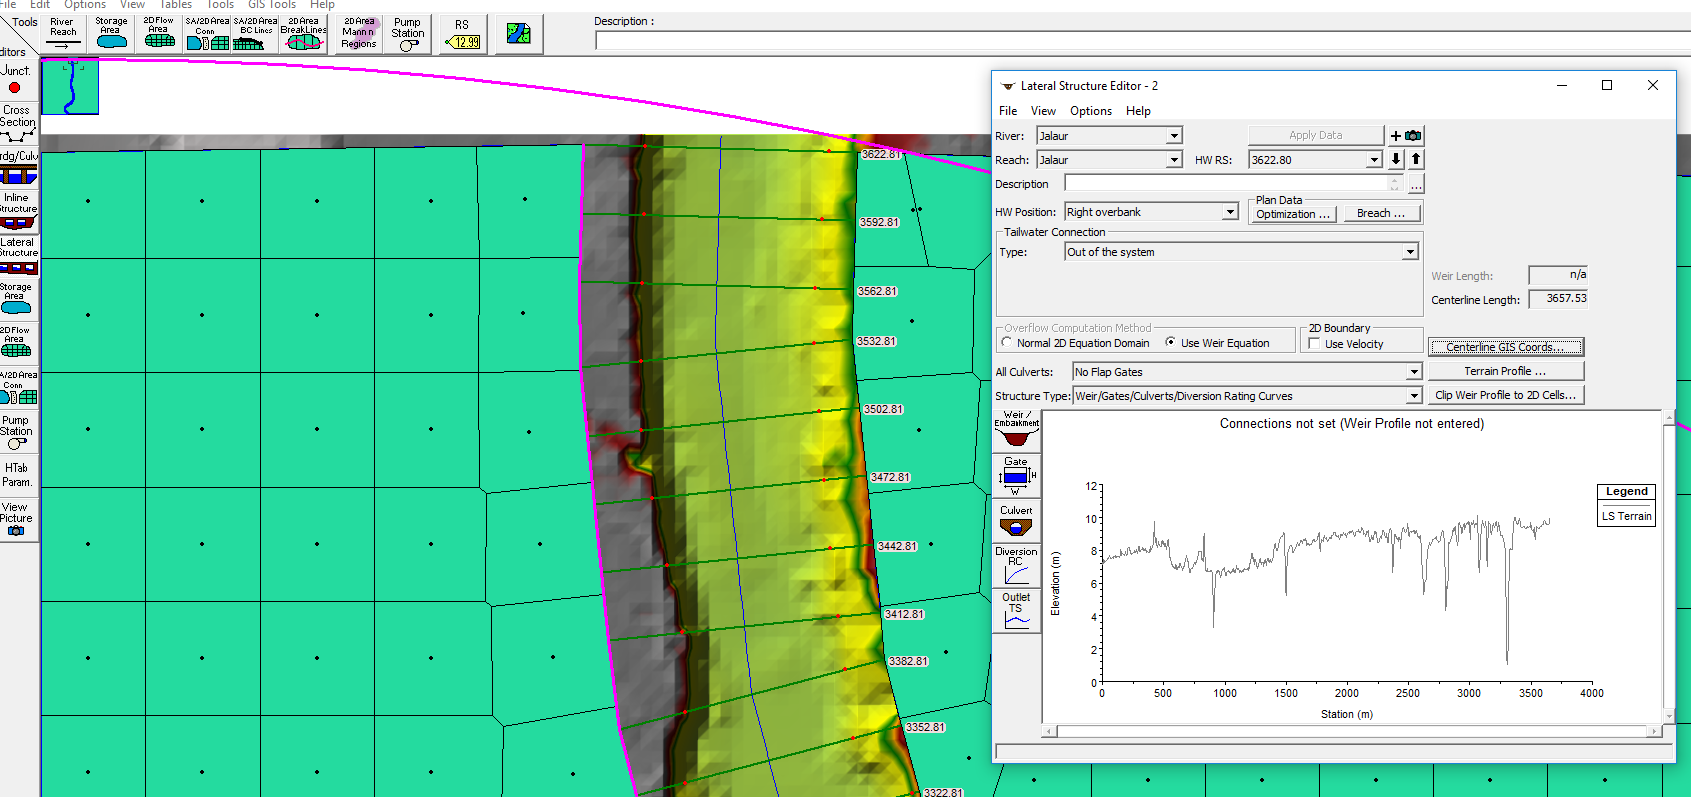
1) I created a lateral structure with the name (river station) 3622.80, 1 mm downstream of the most upstream cross-section (most upstream river station = 3622.81). I copied also the coordinates of a centerline from GIS (Centerline GIS Coords…) that starts just in the most upstream cross-section 3622.81 and finishes in the most downstream cross-section. This centerline coordinates does not start at 3622.80 with my lateral structure, if not 1mm upstream at 3622.81.
My ls editor looks like this
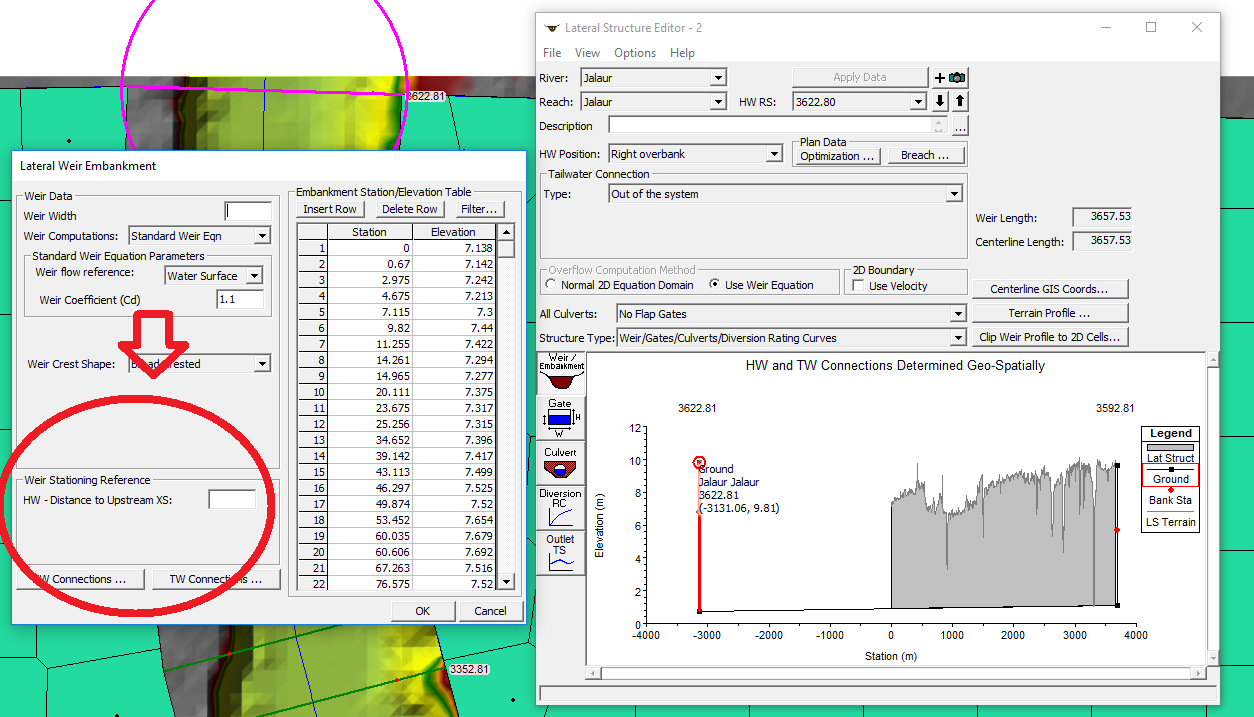
2) I copied the terrain of this centerline (Terrain profile) into the Weir/Embankment editor, and my image looks with the problem I had before where all the terrain is located between the two most upstream cross-sections. I took note of the negative coordinate that you refer (-3131.06, see image below), however, I do not know what this exactly means because the difference between my cross-section station and this number (3622.80-3131.06 = 491.74) is very high, and not the 1mm downstream where I want to locate the LS
4) Now I suppose to write this value into the HW – Distance to upstream? (marked in red) (because this is the real distance?)
…I do not have clear how to continue with this.
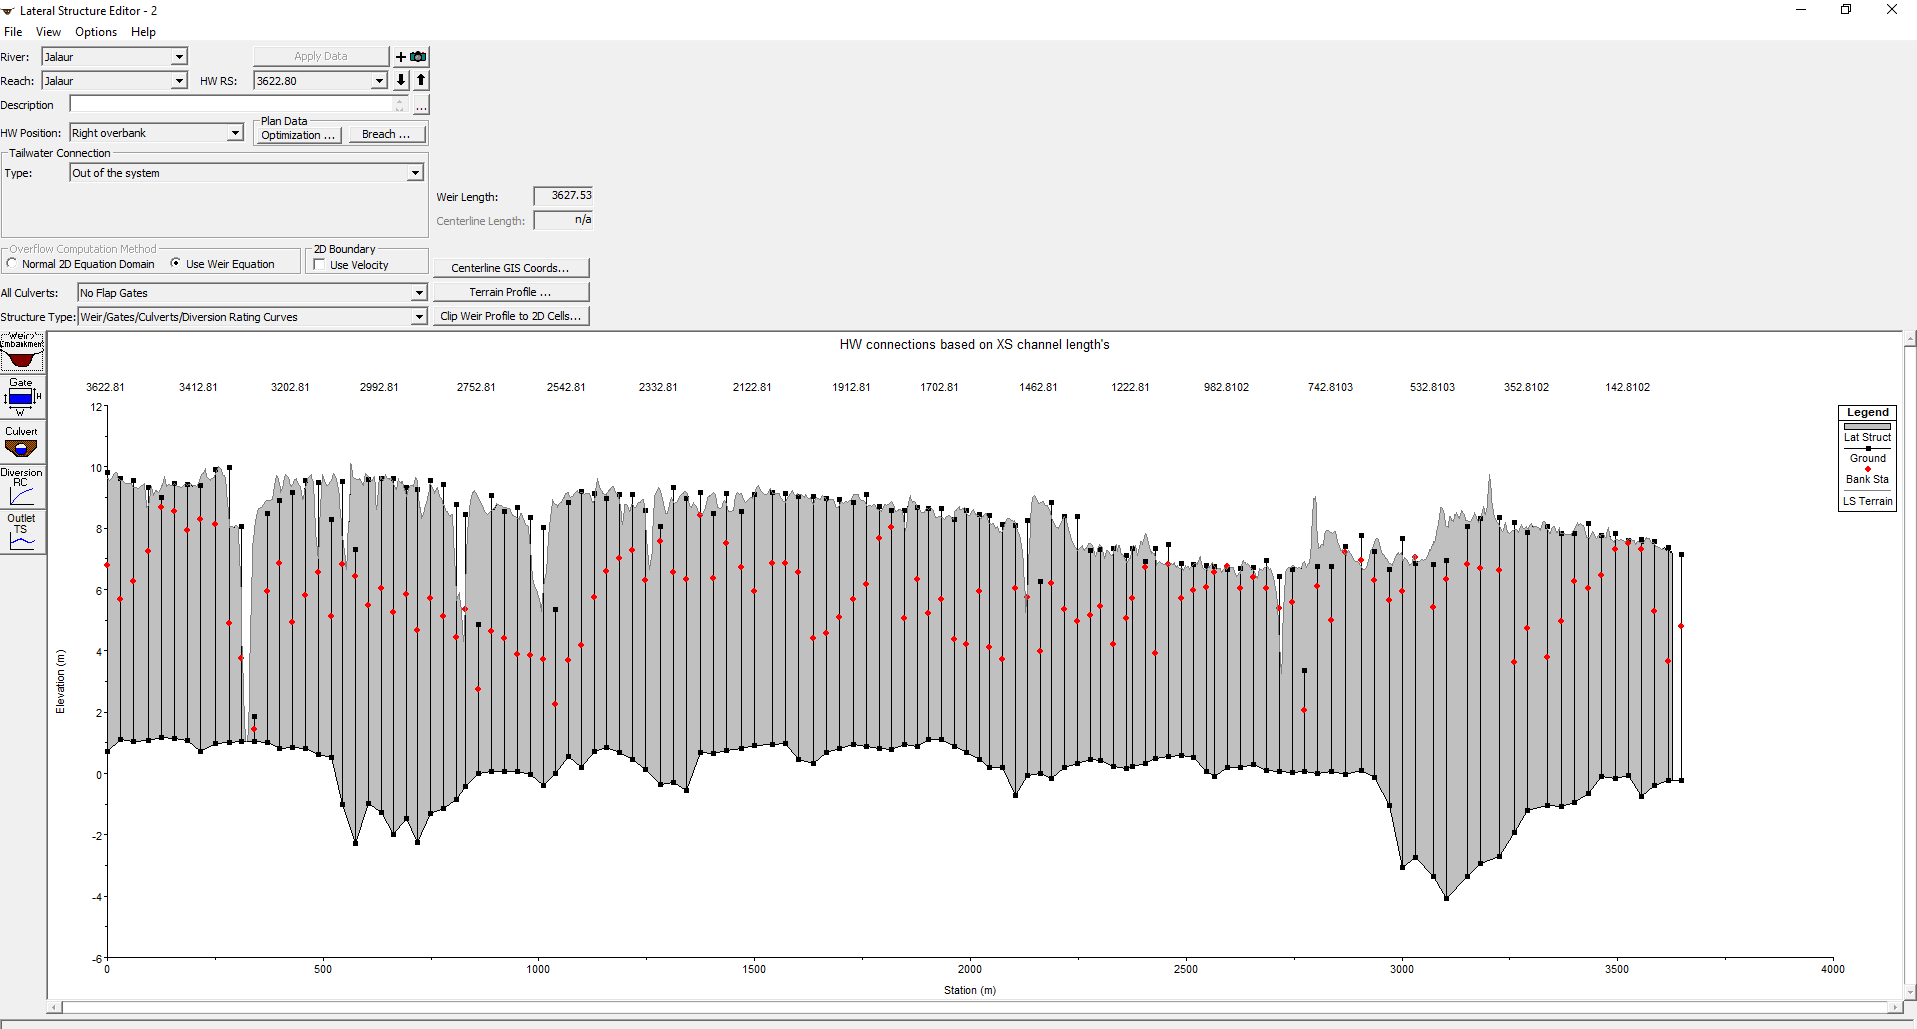
The only solution I found to make all the terrain appears along the cross sections is to delete the GIS coordinates of the line from the Centerline Gis Coords.. button and copy once more the terrain into the Weir/Embankment editor to make the LS terrain matches with the Lat Strut.
and once more I have the problems with the Weir, Cell elevation …but now in more cells… 🙁
Any more tips?
Thank you so much,
Sara
December 5, 2018 at 9:41 pm #11939Scott MillerParticipantThe weir length is much longer than the river length. That will cause problems. See page 3-37 of the 2D manual. Start with a shorter lateral structure, like Luis suggested. It can be replaced with a longer lateral structure later if you think that would be advantageous.
Begin and end the lateral structure at high points along the profile. Do you expect the entire length of the bank to be inundated? If so, replace the short lateral structure later. See how it is supposed to work, first.
Estimate an accurate river station to name the lateral structure. It does not have to be exact. It just has to be a number downstream from a cross section. Use that difference, between the cross section and lateral structure, to estimate the distance to the upstream cross section. You can make it more accurate later, after the cross sections show on the lateral structure profile. (When you enter the distance to the upstream cross section, put in the distance, but do not make it a negative number.)
I should not have stated that 1mm is enough. I see that was confusing. The lateral structure name needs to be between the neighboring cross section station numbers. And there will have to be different numbers for connections to the left and right 2D areas.
The tailwater connection should be set to the 2D area on the right. When that is changed, you ought to see the mesh cell elevations along the profile. The error with lateral structure elevations being below the mesh cell elevations can be corrected for most mesh cells by adding a small height to all the profile elevations.
The last image above looks best. I’m not sure why deleting the GIS coordinates would help. Is the direction of the GIS coordinates from upstream to downstream? That may be necessary. How many stations were there on the elevation profile?
(One other tip: The green fill can be removed from the mesh cells under geometry view options. This makes the terrain visible.)
December 10, 2018 at 9:01 pm #11940SaraAParticipantHi Scott,
Thank you so much for the help these days. I read carefully the User’s manual and with your tips, I could solve finally the problem with the connections. I did with a smaller LS.
The problem indeed is that I was defining the GIS centerline coordinates from downstream to upstream. I also have clear the difference with the river stationing and weir stationing that are not the same, and for the weir are relatives. Now it is clear the negative number (for the upstream cross-section of the LS) we were speaking about, as it refers to this relative zero of the weir.
I only have one question related to a statement I read in the User’s Manual: The user enters stations/elevations from the upstream end to the downstream end of the LS. Everything below these elevations will be filled in to the ground…
What does this sentence mean? which elevations are filled? as I am trying to represent the real terrain. I do not want to fill any elevation between upstream and downstream ends of the LS.
Thank you,
Regards,
Sara
December 11, 2018 at 11:53 pm #11941Scott MillerParticipantYeah. I think it just means you do not need to put in bottom elevations for the lateral structure.
My lateral structures are something like 0.02 foot high, sometimes a little higher, just enough so they are not below the terrain anywhere. That height is not likely to make much difference on the scale of the terrain.
December 12, 2018 at 7:50 pm #11942SaraAParticipantHi Scott,
Thank you for the clarification.
I was wondering how HEC-RAS computes the distance to the upstream XS of my LS.
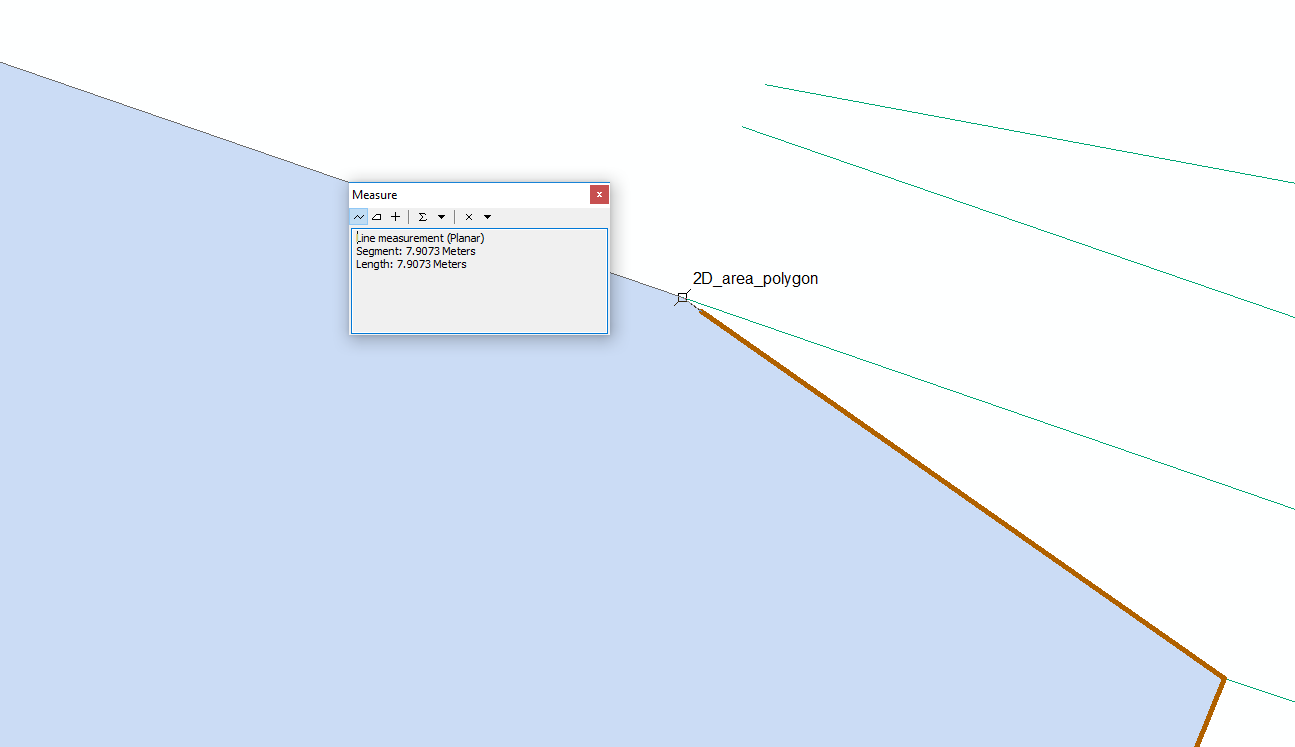
In ArcMap the distance I get is 7.90m (measuring along the centerline of the structure).
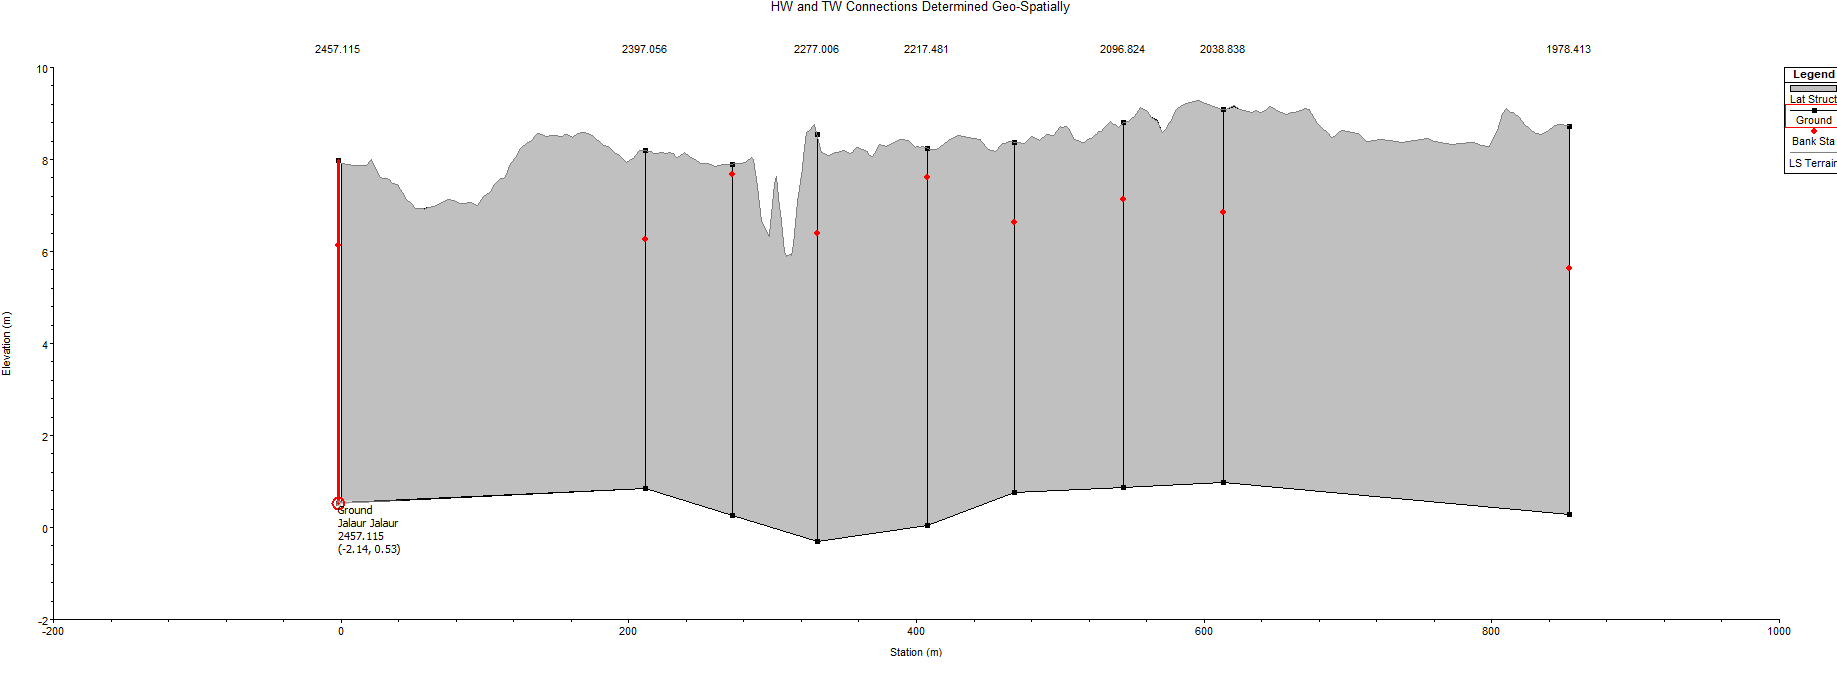
However, in HEC-RAS, the cross section is located 2.14m upstream.
Is this because the distance is not estimated along the lateral structure centerline, if not between river centerline or bank lines centerline?
One last question, is it possible to enforce the 2D mesh to the lateral structure? I only saw the option for a breakline.
Thank you,
Best Regards,
December 12, 2018 at 9:31 pm #11943Scott MillerParticipantTry using a refinement region along the lateral structure. I’ve done this for cell density, but not used ‘enforce 1 cell radius’. That’s an option you can experiment with.
The Hydraulic reference manual does not appear to explain how the distance to the upstream cross section is calculated for the lateral structure profile. That seems to be a question for the RAS developers in Davis, California. I take the distance RAS calculates rather than my estimate because I don’t know better.
December 12, 2018 at 10:45 pm #11944SaraAParticipantHi Scott,
Thank you for the tip of the refinement region.
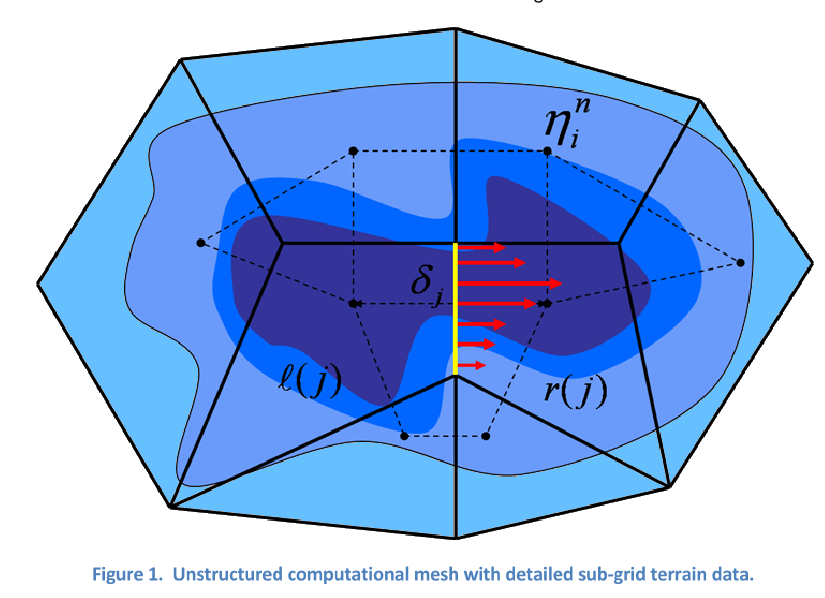
I am trying to analyze 2D in deep and I would like to know if there is a way to see the calculation mesh in HEC-RAS. As I read in some documents, a smaller 2D mesh (subgrid) is generated by Voronoi technique from the 2D mesh cell size that you defined, and this smaller 2D mesh is the one using for calculation.
Do you know if it is possible to see in HEC-RAS the mesh used for the computations? (not the one you define)
Thank you,
Regards,
Sara
December 13, 2018 at 12:59 am #11945Scott MillerParticipantTry it. Define the area and calculation point spacing. RAS distributes calculation points and generates the mesh cells. That *is* the smaller mesh. But I think “smaller” refers to the refinement region within the larger 2D area. I don’t believe it has to be smaller spacing.
Edit the calculation points if there are errors. They should show up, if there are any, but look at the error count at the bottom of the window. Sometimes you just need to use the edit toolbar in mapper to update the mesh.
There is an option to control the cell size outside the refinement region boundary. That may be desirable if there is a large difference in calculation point spacing in the 2D flow area.
December 13, 2018 at 1:02 pm #11946SaraAParticipantHi Scott,
Thank you for the information about the generation and refinement of the mesh, but here it is the “smaller” mesh to which I refer (see image). You have the mesh that you generated (the blue one) and the second one (subgrid, the dash black one) generated by the Voronoi technique. This dash black grid captures the terrain than the blue one is not capable due to a higher size. The blue one is the one you define with the cell spacing and the dash black line is the one you use for calculation as I understood.
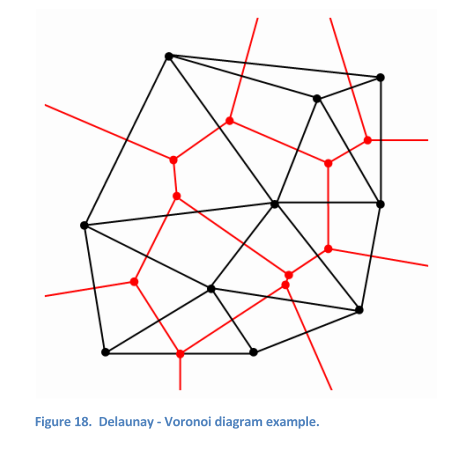
I took the images from the document Combined 1D and 2D modelling with HEC-RAS, and also this document states on page 30. HEC-RAS make the computational mesh by following the Delaunay Triangulation Technique and then constructing a Voronoi Diagram (see image).
Thank you,
Regards,
December 13, 2018 at 8:33 pm #11947Scott MillerParticipantI see. Thanks for showing that. It looks like the document was published by Brunner et al. Same one?
In hydrology we call that Thiessen polygons, at least in the U.S. It is used for dividing precipitation areas between rain gauges. Lines are drawn between the points, the gauges. Those lines form a grid, that step comes first. Lines are then drawn perpendicular to the grid lines, through the mid-point. This becomes the mesh of polygons. The perpendicular lines terminate where they intersect.
For rain gauges this is more suitable for estimating precipitation over flat terrain than in mountainous terrain. Look for Thiessen polygons in ESRI ArcGIS. It looks like this is referred to as the Voronoi technique more commonly in mathematics and computer science.
December 13, 2018 at 8:37 pm #11948SaraAParticipantHi Scott,
though I could connect the 1D and 2D area with the LS and I could transfer water to the 2D area, still my results look not correct.
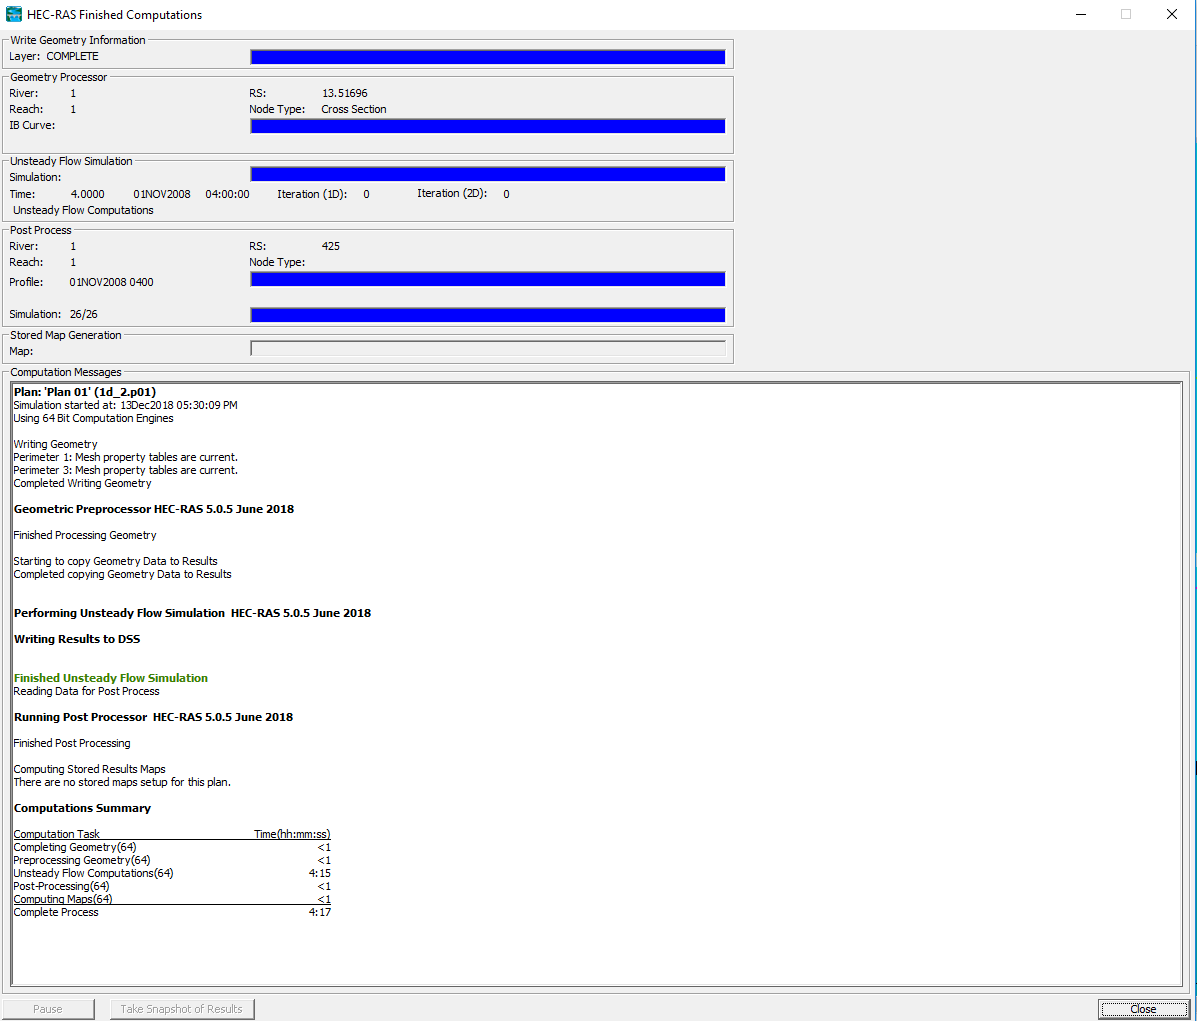
I could run the model with success, as you can see in the image without errors (I did not change the tolerances, I only changed the maximum iterations 1D/2D to 20):
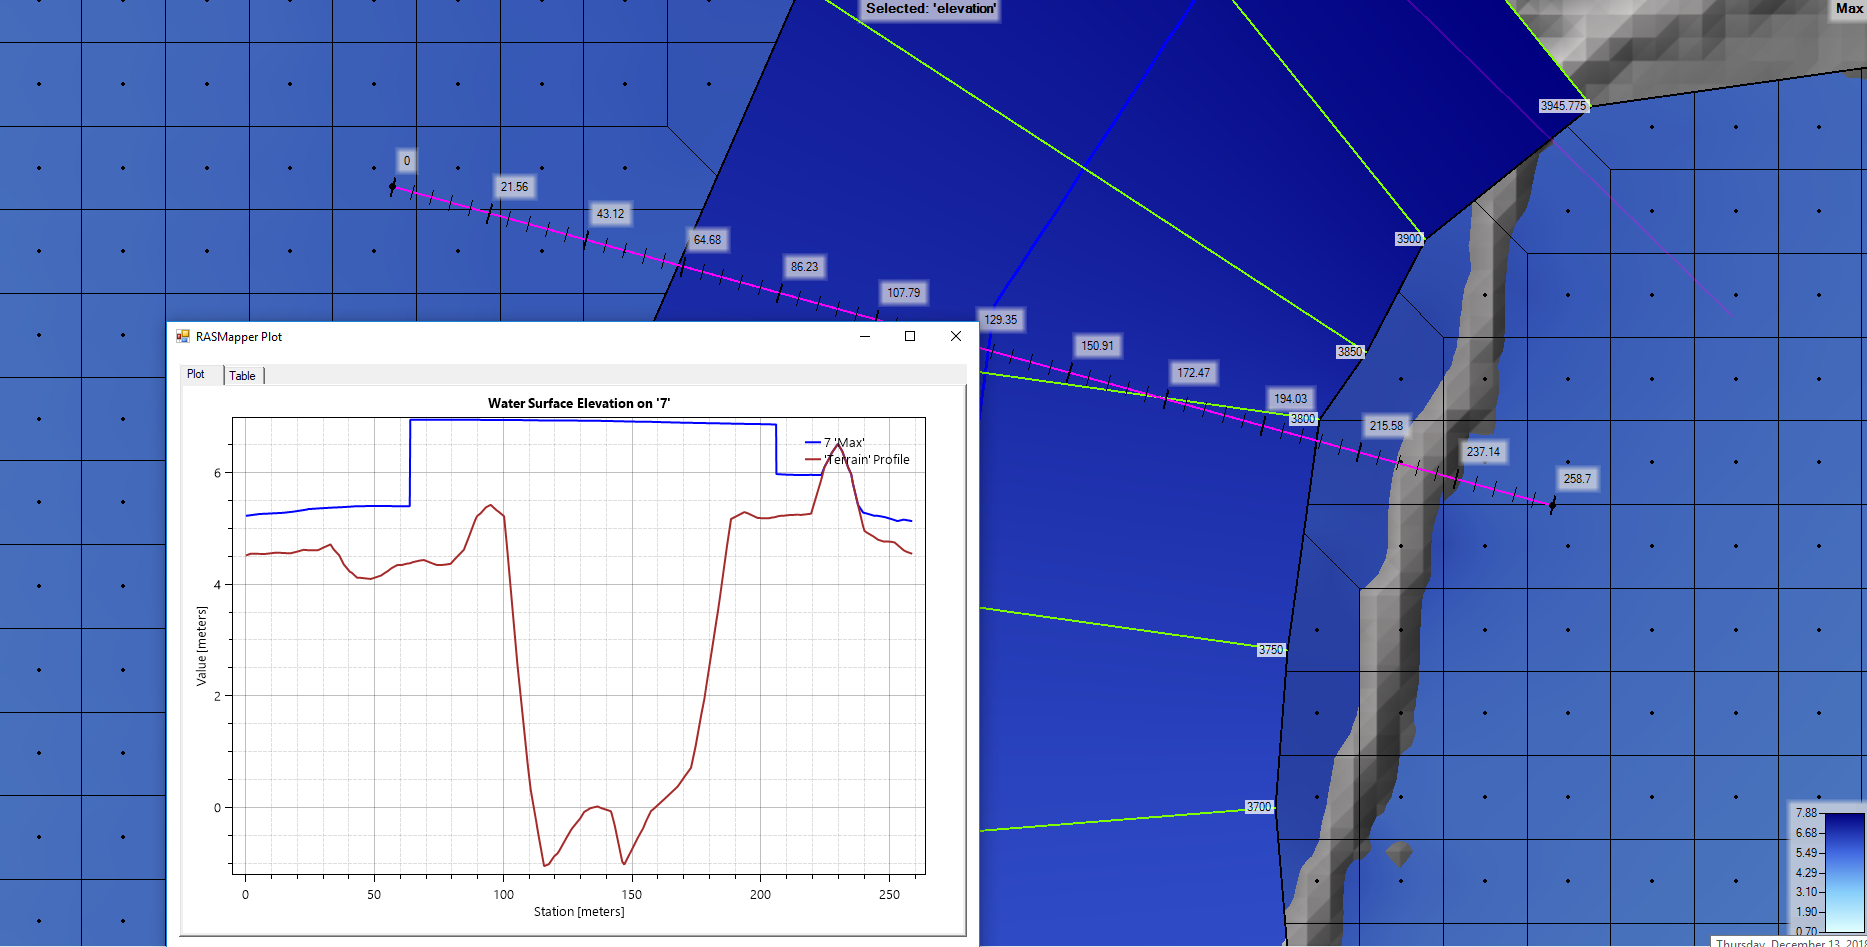
However, when I checked the results you can see a difference of approx. 1.55m between the WSE in the channel and in the 2D area in the same profile. I changed the coefficient of the weir to 0.2 as it is terrain and it got submerged.
Could you give some advice which more parts of the model should I checked?
Thank you,
Best Regards,
Sara
December 13, 2018 at 11:43 pm #11949Scott MillerParticipantHi Sara,
The tolerance ought to be scaled to the flows you expect across the lateral structures. What are the defaults and how do they compare with the flows your model gets? You might lower the minimum flow tolerance or number of iterations to get an idea of what flows are problematic. Then adjust the minimum flow tolerance so there are only a few minor 1D/2D flow errors (or none).
My assumption is that the minimum flow error applies to each lateral structure equally. So it makes sense to adjust the lateral structure lengths and locations to equalize flow through them, more or less.
Take a look at Chris’s reply to Toby’s comment in Weir Equations in HEC RAS. Are the model’s lateral structures using the normal 2D equation domain or the weir equation? That may make a difference.
Also, taking a look at the blog post I see that a “zero-height weir” was not appropriate for connecting 1D/2D with a lateral structure. It should have been “broad-crested weir” in my model, where I was doing a similar 1D/2D connections to yours (and I had water surface super-elevation problems). Check that.
December 17, 2018 at 7:30 pm #11950SaraAParticipantHi Scott,
I read the comment of Toby and the reply of Chris. Good tips!
however, I have one question in how to incorporate this advice in my model. Chris states:
Do not have cells adjacent to the lateral structure that reside completely on the slope of the levee/berm/whatever you’re modelling with the lateral structure. I typically like to take the cross sections right to the peak of the high ground feature, but start my 2D cells at the toe of the feature.
If I imported my LS as a georeferenced line from GIS following the high ground, and the connection between the LS in HW and TW is done automatically, how I can ensure connecting the LS with the toe of the LS for the TW connection?
Relate to the other data, I also read in the same post that if you select Zero Height as a shape of the crest, you should not use a coefficient too low (0.2) for non-overbanked terrain. This value for the coefficient (0.2, for example) is only used with the Broad crested standard equation. If you select Zero Height, you should use Hager’s equation, but, for that equation, you need also the weir average height and the average bed slope…I suppose you can estimate that in a GIS software but it looks very time-consuming considering you have several LS at both sides.
Which option you recommend…(1). use the Zero Height and the Hager’s equation, or (2). the non-overbanked coefficient (low) and the broad crested standard equation?
Do you know if the bug to which Chris refers about the use of Zero height and the Standard equation has been already solved?Thank you,
Best regards,
Sara
December 18, 2018 at 4:25 am #11951Scott MillerParticipantI find those two sentences difficult to understand. Chris appears to have meant the longitudinal peak and toe of slope. Put the ends of the lateral structures at high points along the 1D/2D interface.
I don’t know about the ‘bug’. I read the guidance as recommending use of a broad crested weir, and not zero height. Use the normal 2D equation domain if the terrain is not acting as a weir.
December 18, 2018 at 12:41 pm #11952SaraAParticipantHi Scott,
Reading the User’s manual of HEC-RAS 5.0, I found on chapter 6.87 (page 169): The last selection (crest shape) is when there really is no weir, and flow is just travelling overland. This is called “Zero Height” weir.
Also, Chris states in the blog (Weir Equations in HEC-RAS): Zero-height weirs are used for cases where flow will leave a channel laterally, but there is no defined obstruction or hydraulic control separating the two. Commonly this is used to simulate flow from the main channel up a tributary that is being modelled using a lateral structure and a storage or 2D area.
Where did you read is recommended to use broad crested weir?
Thank you,
Regards,
Sara
-
AuthorPosts
- You must be logged in to reply to this topic.
