Welcome to the RAS Solution Forums HEC-RAS Help Channel n values in Manning’s n Table (light green background)

Viewing 5 posts - 1 through 5 (of 5 total)
  • Author
    Posts
  • #6317
    V
    Participant

    I have defined multiple roughness values for my cross sections using land use mapping done in GIS. At most sections, the bank points do not correspond to the change in vegetation/land use locations. As a consequence, the channel n values displayed in light green in the Manning’s n Table do not correspond to the correct n value between the bank stations. Some sections do not show any n values corresponding to the channel.

    Should I be concerned about this? Will it have an impact on the results? Should I be imposing additional Manning’s n breaks at the bank station locations?

    #10319
    cameron
    Participant

    how did you define your bank stations? You don’t need to have changes in n values at bank stations, but usually the n values that are inside your banks does appear green to help visualize what n values it will use. HEC-RAS will create one n value for inside banks while it is running and there are options to adjust how it does this.

    #10320
    V
    Participant

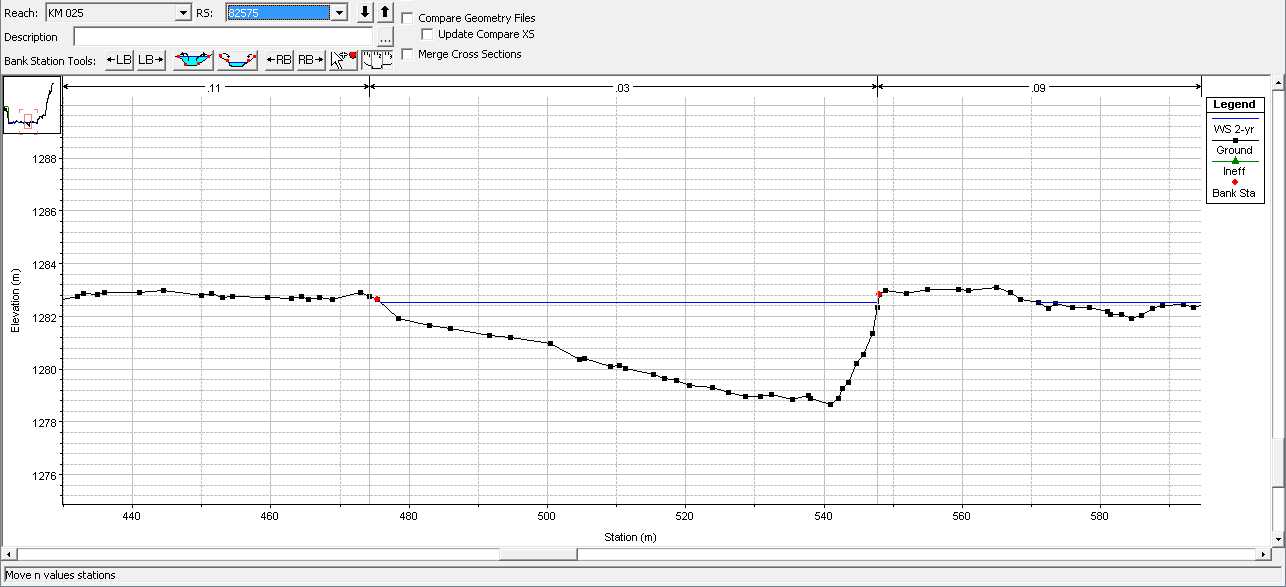
    The bank stations are defined roughly at the 2yr water level, close to the change in slope.

    I’ve attached images showing three example sections to compare with the green shaded area identified by RAS as the channel (see first post).

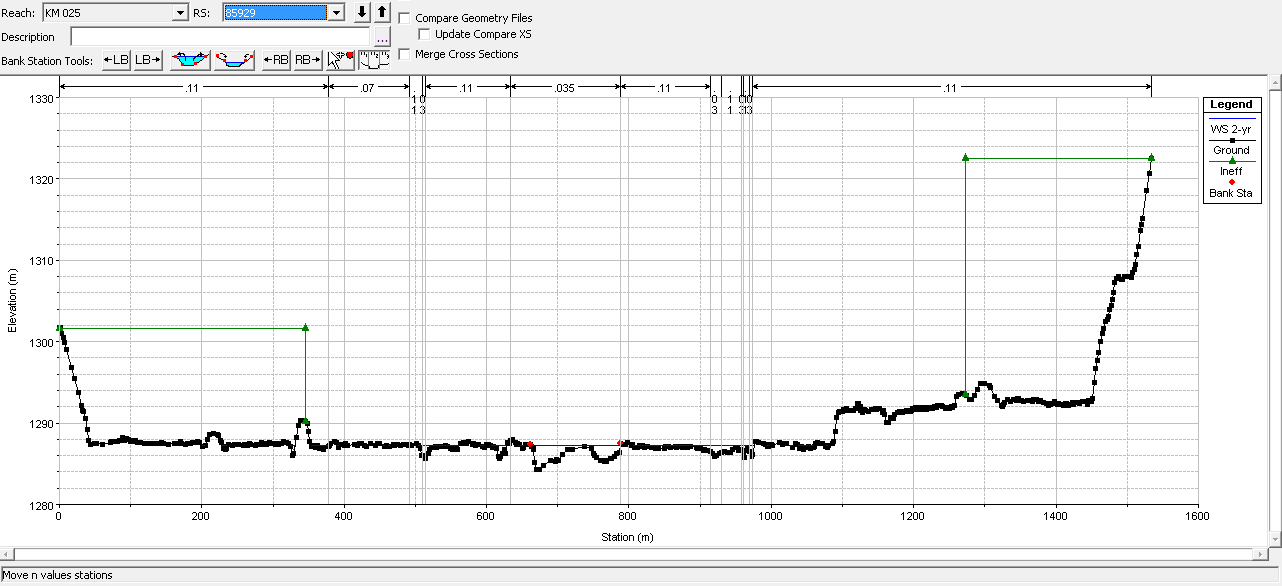
    XS 85929 n channel should be 0.035 (no channel n identified)
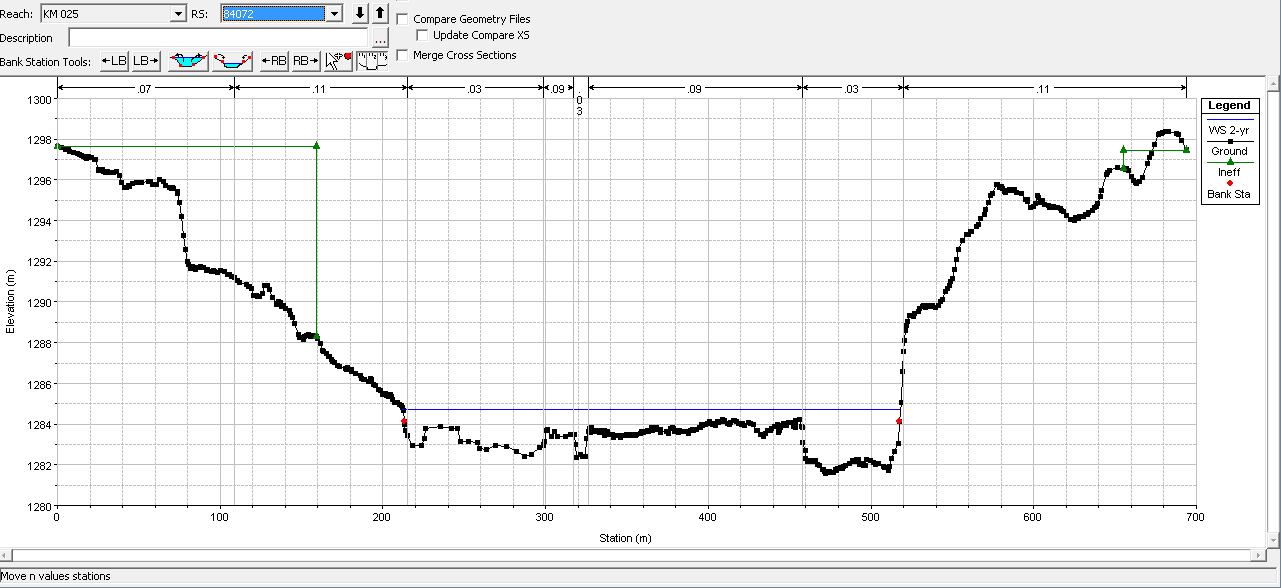
    XS 84072 n channel is identified correctly
    XS 82575 n channel should be almost entirely 0.03 (not 0.09)

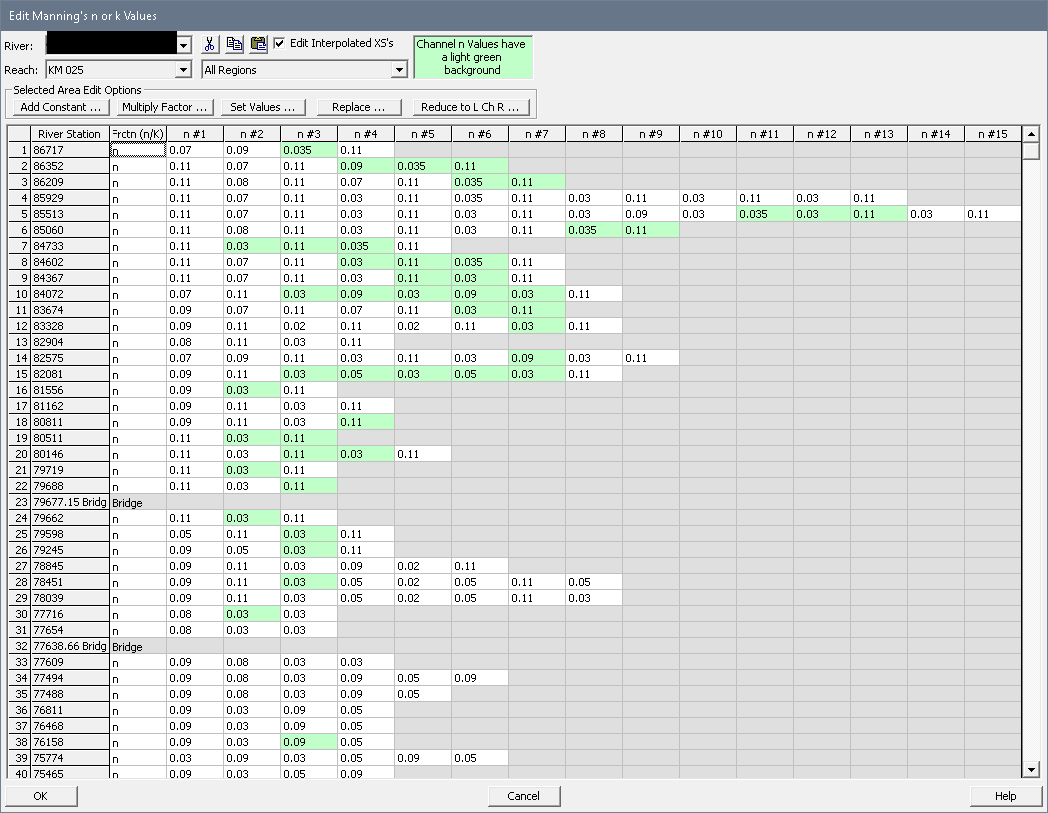
    It appears from the examples above that RAS does not recognize any n values specified before the left bank station.

    I think the solution would be to repeat the previous n values at the left bank station locations. Is there an “easy” way to specify the station of new n values? I have hundreds of sections and don’t want to specify them manually in the Cross Section Editor.

    From the Bank Station Table, I know where I want to impose new n values (left bank stations) and, if I could get a blank cell to show up at the bank station locations in the Edit Manning’s n Table, I could easily fill in the n values by working in excel. But I can’t think of an “easy” way to specify that I want new n values at the left bank stations so that the blank cells show up in the Edit Manning’s n Table. Any ideas?

    I suppose the alternative would be to do the edits in GIS and re-import the n values using GeoRAS.


    #10321
    cameron
    Participant

    What happens if you tell it to use just left, channel, and right n values (does it work)? Did you check the composting n value to verify it was working (define in a table)? What happens if you filter some of the points out?

    I don’t think it matters that those areas are not in green, but check the things above as it might bring peace of mind.

    #10322
    V
    Participant

    I just checked the Manning’s n table and it does work if I specify just channel, or left and right overbank values.

    The computed composite n values look correct to me.

    Thanks for your help.

Viewing 5 posts - 1 through 5 (of 5 total)
  • You must be logged in to reply to this topic.