Welcome to the RAS Solution › Forums › HEC-RAS Help › 2D Precipitation and Boundary Condition Inflow Error
- This topic has 5 replies, 521 voices, and was last updated 7 years, 5 months ago by HCL27.
-
AuthorPosts
-
October 3, 2018 at 11:28 pm #7070HCL27Participant
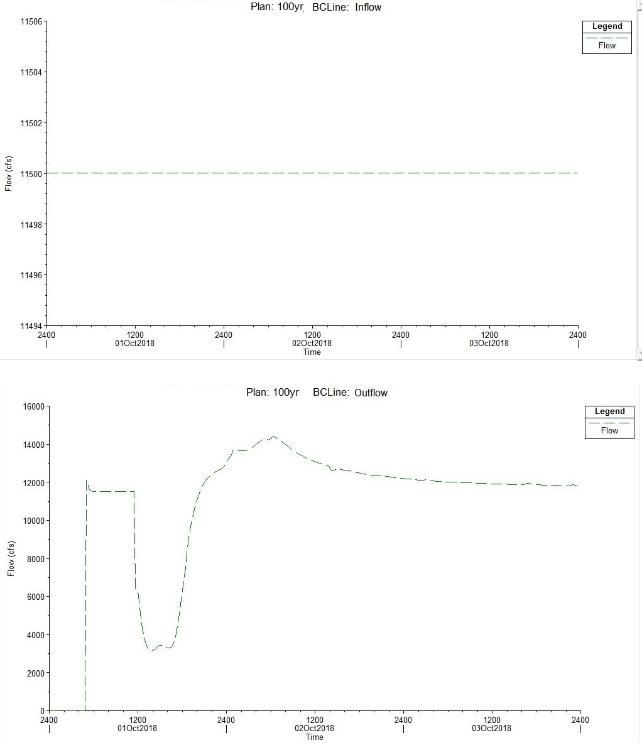
I am coming across an error when incorporating both a 2D Precipitation and a boundary condition inflow for a 2D mesh. I have input the excess precipitation time series from HEC-HMS as a precipitation for my 2D mesh area and then have an upstream boundary condition line that has a flow hydrograph with a constant inflow representing the upper part of the watershed. Then there is a downstream boundary line with normal depth.
After running the model and reviewing the results, I noticed there is a decrease in flow below the constant inflow when the precipitation begins. Does anybody know why I might be having this issue?
Here are the upstream and downstream boundary lines.
Thanks!
 October 4, 2018 at 7:08 pm #11796AnonymousGuest
Looks light volume is escaping your model elsewhere prior to hitting your boundary condition and then once the available outflow area volume matches more consistently with the inflow, it begins to normal out.
Question, what is your mass balance % error in the computation log file?
October 4, 2018 at 9:23 pm #11797HCL27ParticipantThe Percent Error is 0.03992.
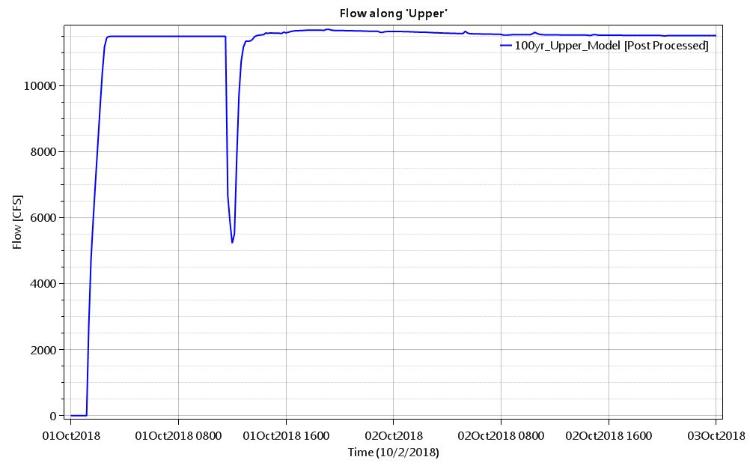
Its strange because the hydrograph drops right when the first drop of precipitation falls at 11:30. And the drop is consistently at this time when I check the flow hydrograph at other places along the main channel that has the baseflow.
Here is a hydrograph of a profile line at the upper end of the model.
 October 4, 2018 at 9:56 pm #11798AnonymousGuest
Ok how does it look in RAS mapper; sometimes you can find erros by putting max extents for velcoity and then depth after and seeing if there is CRAZY odd numbers
Also are you using a warm up time and ramp up percentage? Dont, turn it off
October 8, 2018 at 9:50 pm #11799HCL27ParticipantI took a look in RAS Mapper and I did not notice any abnormalities in the maximum extents of the velocity or depths.
I was using a warm up time and ramp up percentage. I turned that off and re-ran the model but the results were the same. I don’t think this is causing the issue but should I avoid ramp up periods in future models? Is there issues with this? I have used them before and have not noticed any issues.
This issue is only occurring in the drainage with the inflow hydrograph. The other drainages in the 2D area with precipitation only, have normal looking hydrographs.
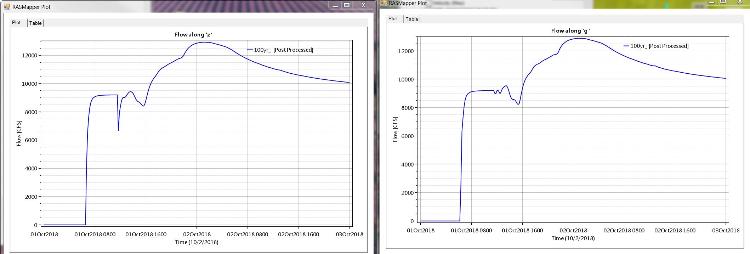
I think the issue is cell size or cell volume related? A smaller size reduces the dip in the hydrograph but the dip is still there. Also when looking at hydrographs in areas with a wider floodplain and smaller depths the hydrograph does not dip as much.
Here are hydrographs taken 1/2 mi apart. The first in a narrow area with large depths and the second in a wider area with shallower depths. You can see a sharp dip in the first plot but not in the second.
 January 11, 2019 at 6:22 pm #11800AnonymousGuest
Hi,
I am a beginner in HEC-RAS, I need some help regarding adding the precipitation in the HEC-RAS. I am also using the constant inflows at the input boundary conditions and also adding the precipitation. The basic problem in understanding I am facing is:1- What does the actual mean of time series of precipitation? Is it mean the accumulated rainfall?
for exampleDate Simulation time Precipitation (mm)
11-01-2019 07:00 00:00 30
11-01-2019 08:00 01:00 30
11-01-2019 09:00 02:00 30Does it mean the total rainfall added on the 2D flow area during the whole simulation time is 90 mm? Please elaborate?
Thanks
-
AuthorPosts
- You must be logged in to reply to this topic.