
February 20, 2025
Full Momentum Episode 37: All Things Gates
Gates play a crucial role in hydraulic modeling, impacting water flow, flood control, and dam operations.
Scripting in RAS Mapper is useful for analyzing, comparing, and communicating RAS raster results. RAS Mapper’s RASter Calculator can answer questions like “What velocity values do not exceed 1 ft/s at different time steps?” and “Where does velocity never exceed 1 ft/s?”. Additionally, the RASter Calculator can compare two different plans and answer questions such as “What are the differences in water surface elevation?” or “Where do the plans’ maximum inundation extents agree and/or disagree?”. Getting creative with user-defined RASter Calculator scripts can help you answer your client’s toughest questions.
This RAS Solution blog post is divided into six sections. First, we introduce the RASter Calculator’s primary functions. Next, we discuss how to generate scripts. Third, we show how to create a Dynamic Calculated Layer. Then, we work through a Static Calculated Layer example. Fifth, we save the Calculated Layer and use post-processing tools to convert an exported raster into a shapefile. Lastly, we compare two different RAS results by developing a user-defined script. This RAS Solution blog post and the RASter Calculator process is visualized by the following flow chart.
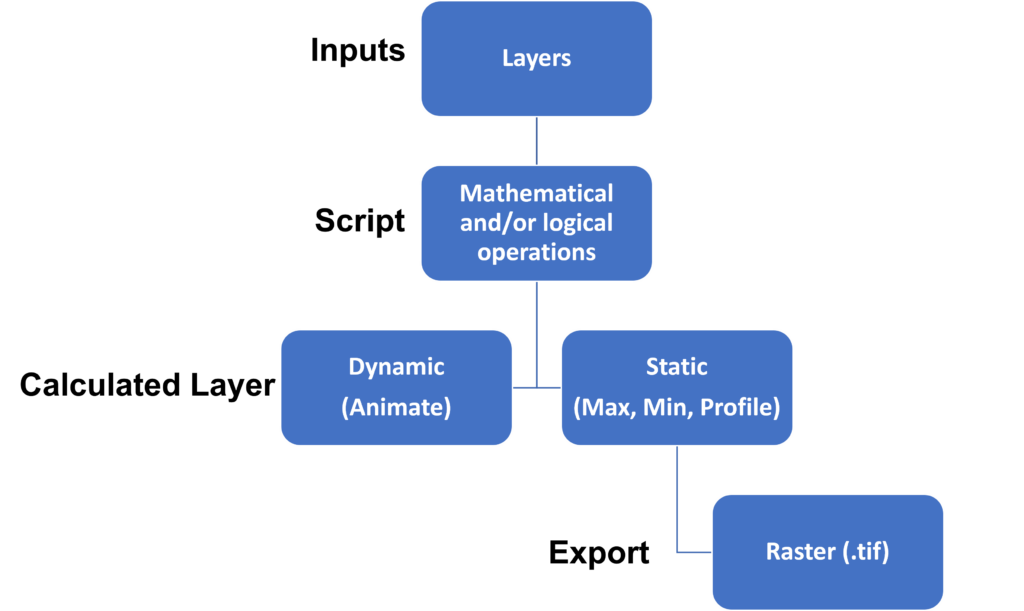
The example and user-defined scripts rely on imported Layers for analysis. These Layers can be the raster results from your plan simulations, for example; depth, maximum water surface elevation, or velocity. The Terrain Layer is available by default. Layers act as variables in the script. Scripts perform mathematical and/or logical operations on the Layer(s) to create a Calculated Layer. The Calculated Layer can then be evaluated in RAS Mapper through interactive point querying and with profile lines. The Calculated Layer can either be dynamic or static. Dynamic Calculated Layers allow the user to evaluate various time steps via the animate toolbar. Static Calculated Layers perform scripted operations on a profile time step, maximum, or minimum. The basic steps to create a Calculated Layer are below.
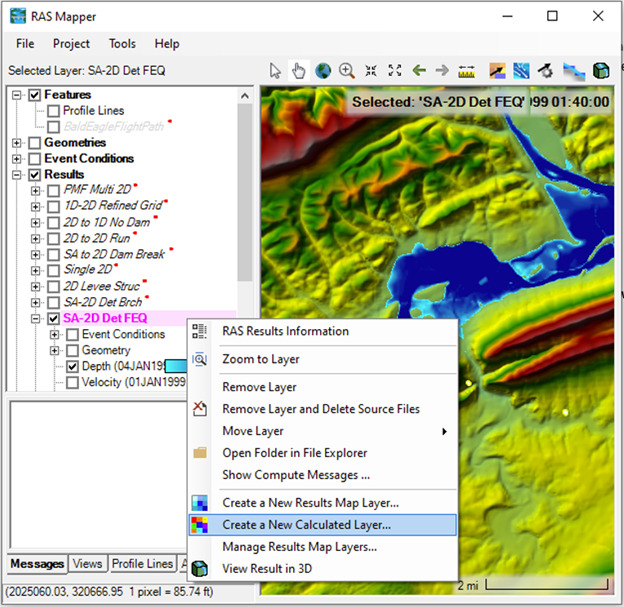
In RAS Mapper, under Results in the content pane, activate and right-click a Plan, and select Create a New Calculated Layer…
The Calculated Layer will be added to RAS Mapper after clicking the Create Layer button. Neither Dynamic or Static Calculated Layers are saved locally when added to RAS Mapper. The process to save and export Calculated Layers as raster .tif files is discussed in the section titled “Save and post-process Calculated Layers”.
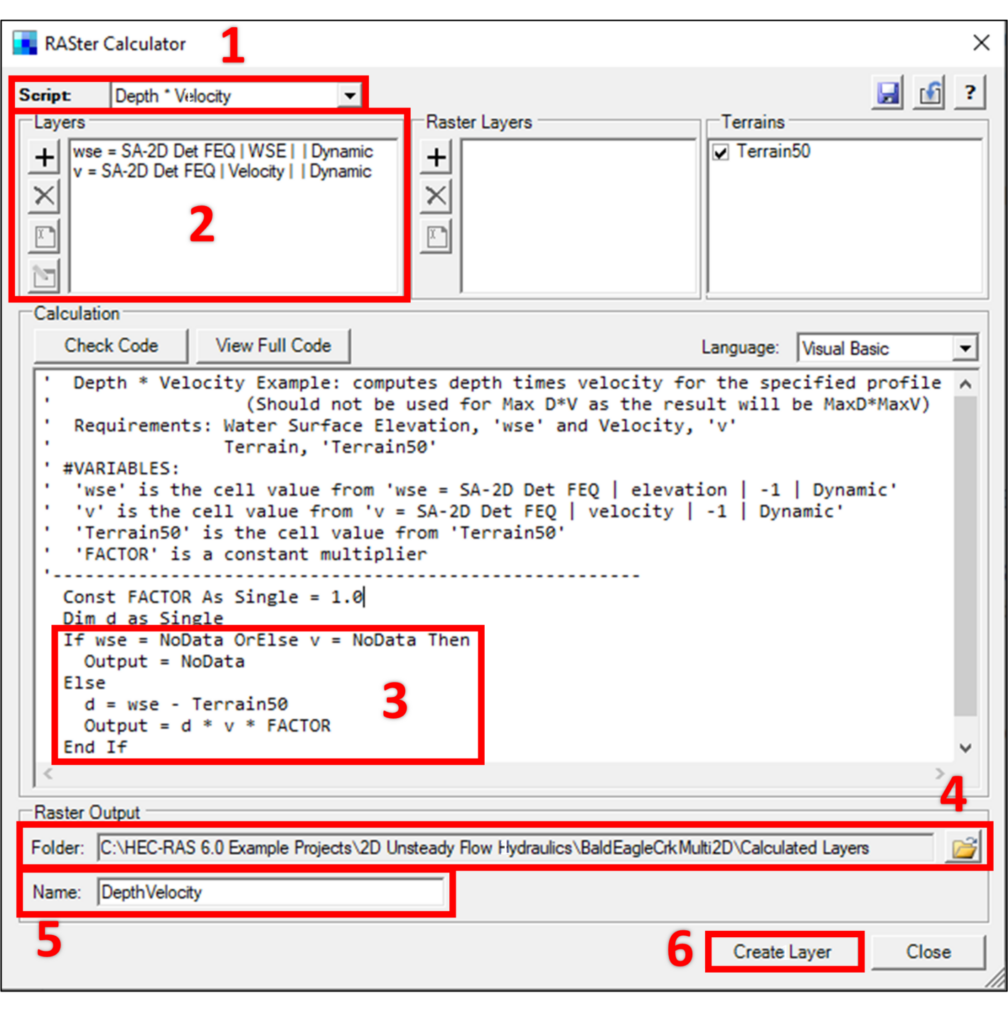
Scripts are written in a simple text editor using either Visual Basic or C#. The RASter Calculator has three example scripts to help perform common calculations; Compare WSE, Depth*Velocity, and Hazard. The “Compare WSE” script helps compare different plans by answering the question “What are the differences in water surface elevation?”. Unique raster functions may be created, modified, saved, and shared by generating a User Defined script.
RAS results are evaluated by performing mathematical and logical operations on the Layers. Mathematical operations include: addition, subtraction, multiplication, division, maximum, and minimum. Logical operations include: If, Then, Else, And, Or, etc. Help for RASter Calculator scripting can be accessed by clicking the question mark Help button. The Help menu provides information about Visual Basic logic, math functions, and example scripts.
Use Check Code to verify whether your script will compile. If the code compiler fails, use the View Full Code button to check all lines of the script for potential errors. The code will automatically compile when the Calculate Layer is evaluated.
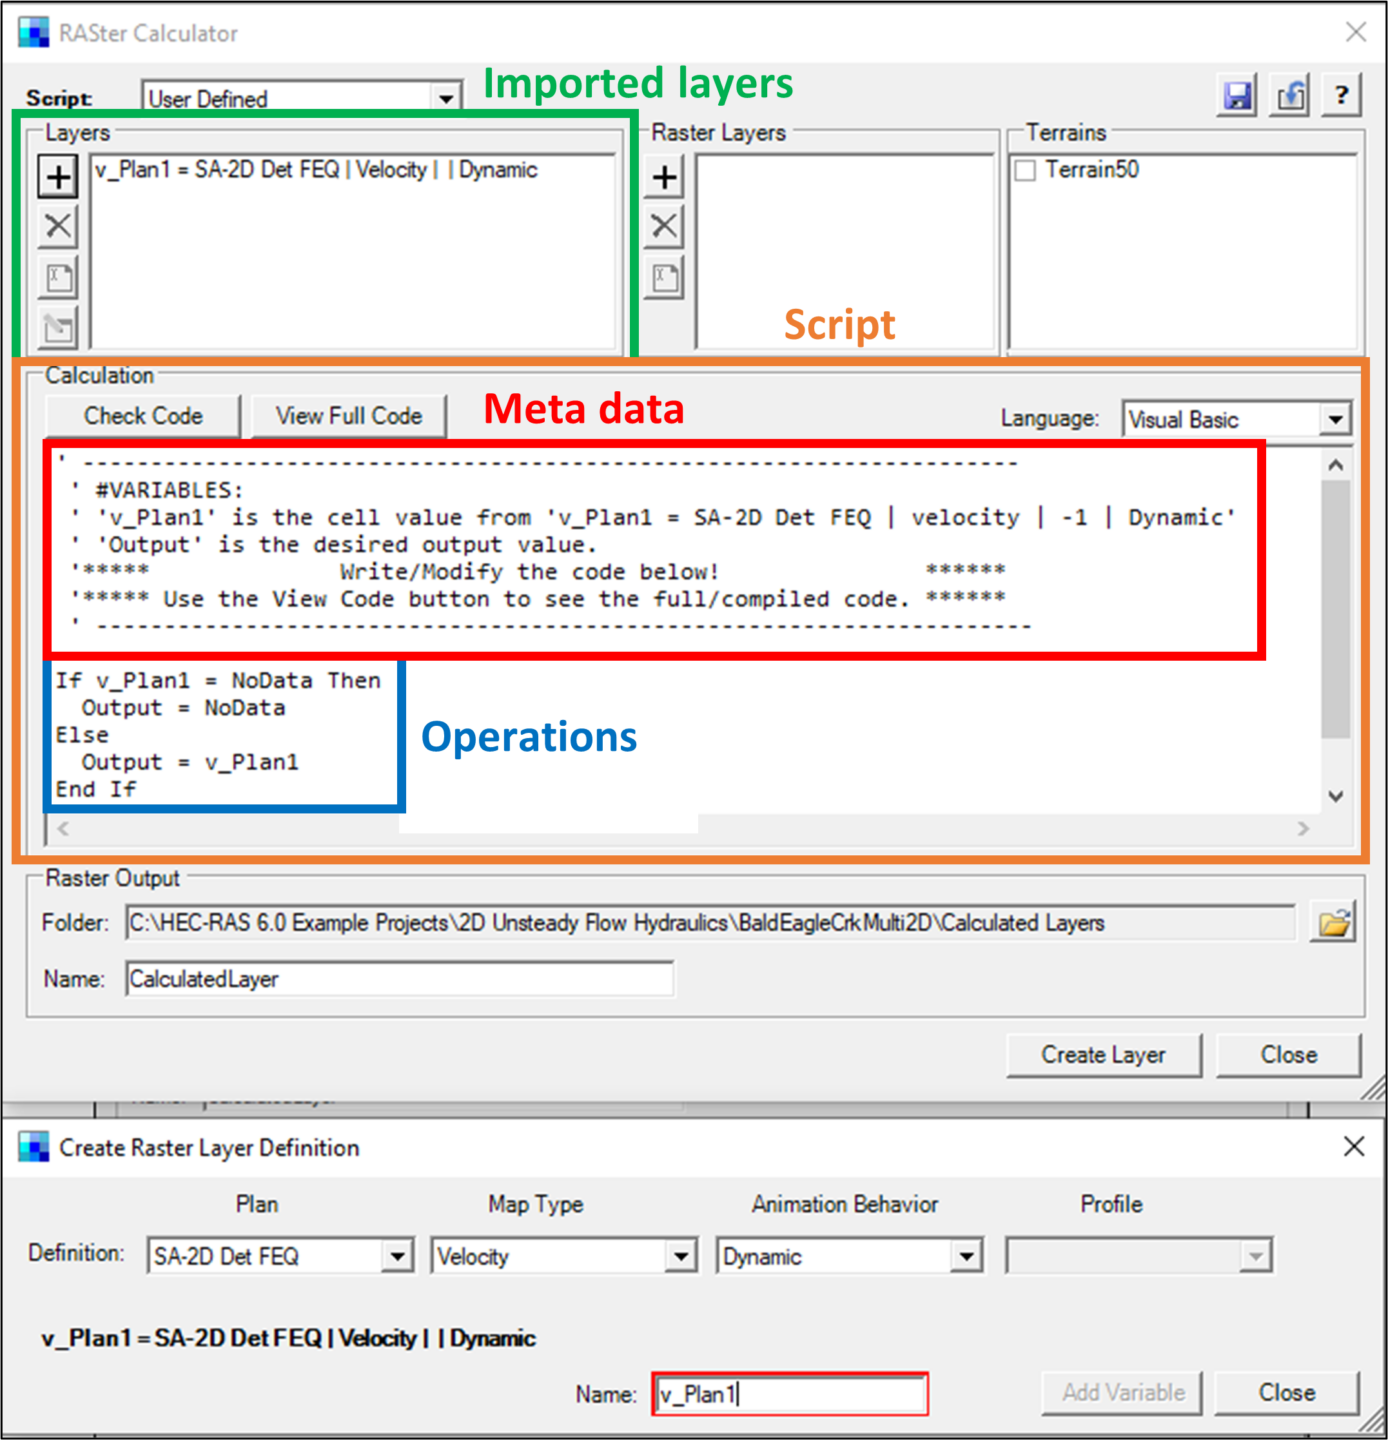
Dynamic Calculated Layers can evaluate any time step in the animate toolbar. Let us answer the question “What velocity values do not exceed 1 ft/s at different time steps?”. The phrase at different time steps means that we should use a dynamic Layer input. First, add the SA-2D Det FEQ plan’s velocity layer to the RASter Calculator. Choose dynamic animation behavior and name the layer “v_Plan1”. The layer name “v_Plan1” acts like a variable in our script. Layer descriptions, including the variable names and associated attributes, are automatically generated, and stored at the top of the script. Note, the default auto-generated script operations perform no mathematical or logical evaluations on the layer(s).
Next, we need to think about how to convert the question’s criteria into a conditional statement. The phrasing What velocity values implies that the user may want a continuous, non-binary range of velocity values between 0 and 1. The solution is non-binary because we return the Layer’s continuous velocity values where conditions are satisfied. The term do not exceed 1 ft/s means that we should only keep velocity values less than or equal to 1 ft/s. These criteria can be described by the following conditional statement:

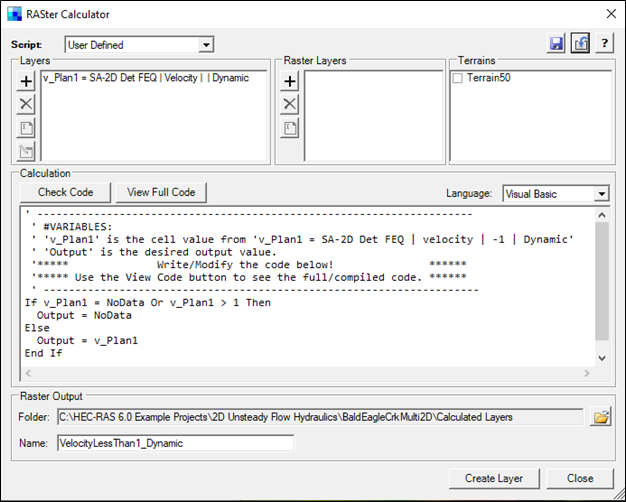
Next, we need to convert our question’s conditional statement into Visual Basic operations for the script. To return a raster of continuous velocity values less than or equal to 1 ft/s, we need to remove velocity values that do not fit our criteria. The NoData value in HEC-RAS is equal to -9999. RAS Mapper does not plot the value of -9999 in the RAS Mapper viewing window. Therefore, we can filter our continuous velocity raster by setting all velocity values greater than 1 to NoData. For completeness, current NoData values should remain NoData values in the evaluation.
The following example script shows the Visual Basic operations:
If v_Plan1 = NoData Or v_Plan1 > 1 Then

  Output = NoData

Else

  Output = v_Plan1

End If
Compile the code and view the Calculated Layer in RAS Mapper by clicking the Create Layer button.
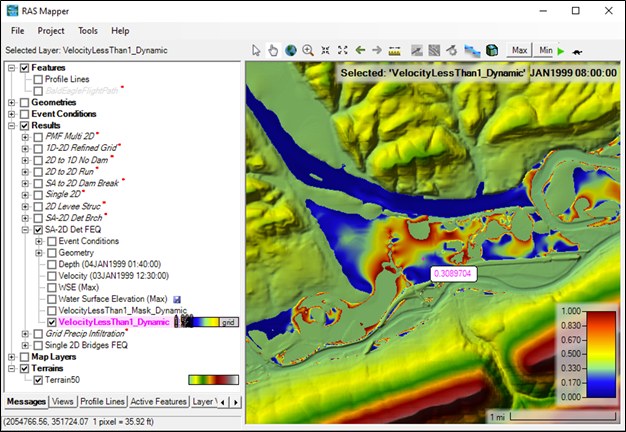
Once computed, the Dynamic Calculated Layer can be animated since the input Layer was dynamic. The Dynamic Calculated Layer can be evaluated for each simulated time step in the animate toolbar.
Static Calculated Layers evaluate a specific profile time step or a RAS result’s maximum/minimum. For the next example, we will answer the question “Where does velocity never exceed 1 ft/s?”. Like before, we need to think about how to convert the question into a conditional statement. The terminology Where does velocity may imply that the user only wants a binary solution. The solution is binary because a single value (1) is returned for areas where conditions are satisfied (True). Likewise, a single value (NoData) is returned for areas where conditions are not satisfied (False). Binary or discrete solutions are useful for creating raster masks and shapefiles. The phrase never exceeds 1 ft/s means that we should apply the conditional statement to the static maximum velocity raster. The static maximum velocity raster represents each cell’s maximum velocity sampled from all time profiles in the simulation. This can be implemented as the following conditional statement:

First, add the SA-2D Det FEQ plan’s maximum velocity layer to the RASter Calculator. Choose the Fixed Profile animation behavior and Max profile. As a reminder, the default auto-generated script performs no mathematical or logical operators on the layer.
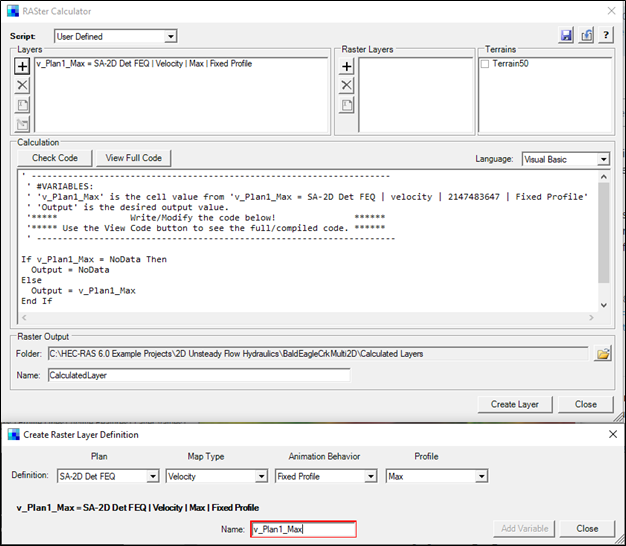
Second, convert the conditional statement into Visual Basic operations:
If v_Plan1_Max = NoData Or v_Plan1_Max > 1 Then

  Output = NoData

Else

  Output = 1

End If
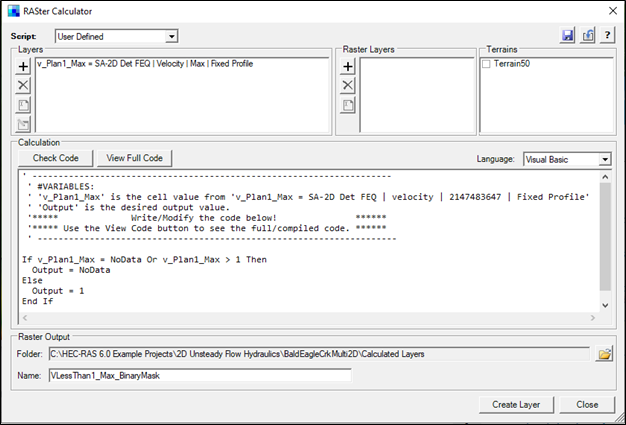
Compile, save, and evaluate the script by clicking the Create Layer button. View the Calculated Layer in RAS Mapper.
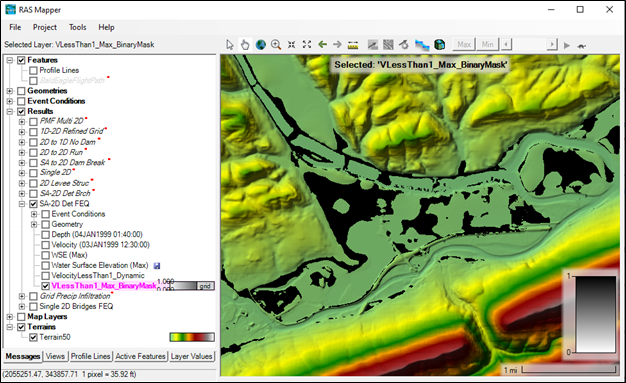
The Static Calculated Layer shows the areas where velocity never exceeded 1 ft/s for all simulation time steps. The Static Calculated Layer was only evaluated for the maximum velocity profile. The script cannot be evaluated for different time steps because the input Layer was static.
Static and Dynamic Calculated Layers can be saved and exported as static raster .tif files. To save a Dynamic Calculated Layer, the user must first choose a time step profile from the animate toolbar. Save the Calculated Layer by exporting from RAS Mapper as a raster .tif file.
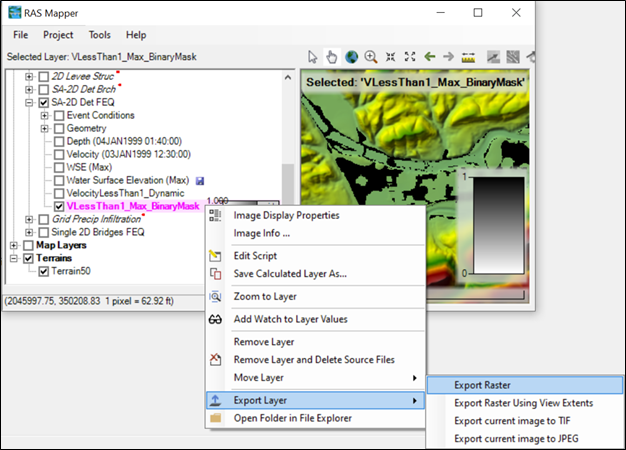
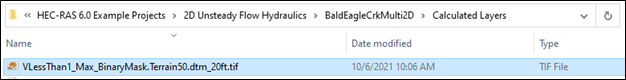
By default, the exported raster will be saved in the “Calculated Layers” folder within the project folder.
Exported raster post-processing is often needed to generate a desired file format or mapping visualization. Let us convert the previous example’s binary raster mask (.tif) into a shapefile (.shp). Open the exported Calculated Layer raster in ArcGIS Pro. The following binary mask raster post-processing methods may be done using QGIS’s “Polygonize (Raster to Vector)” tool or Python’s GDAL and Rasterio modules.
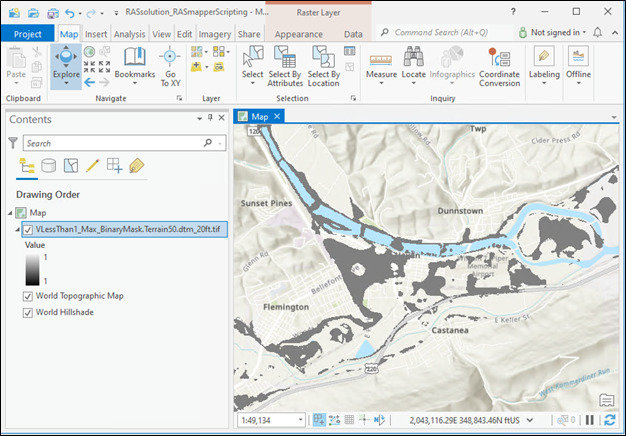
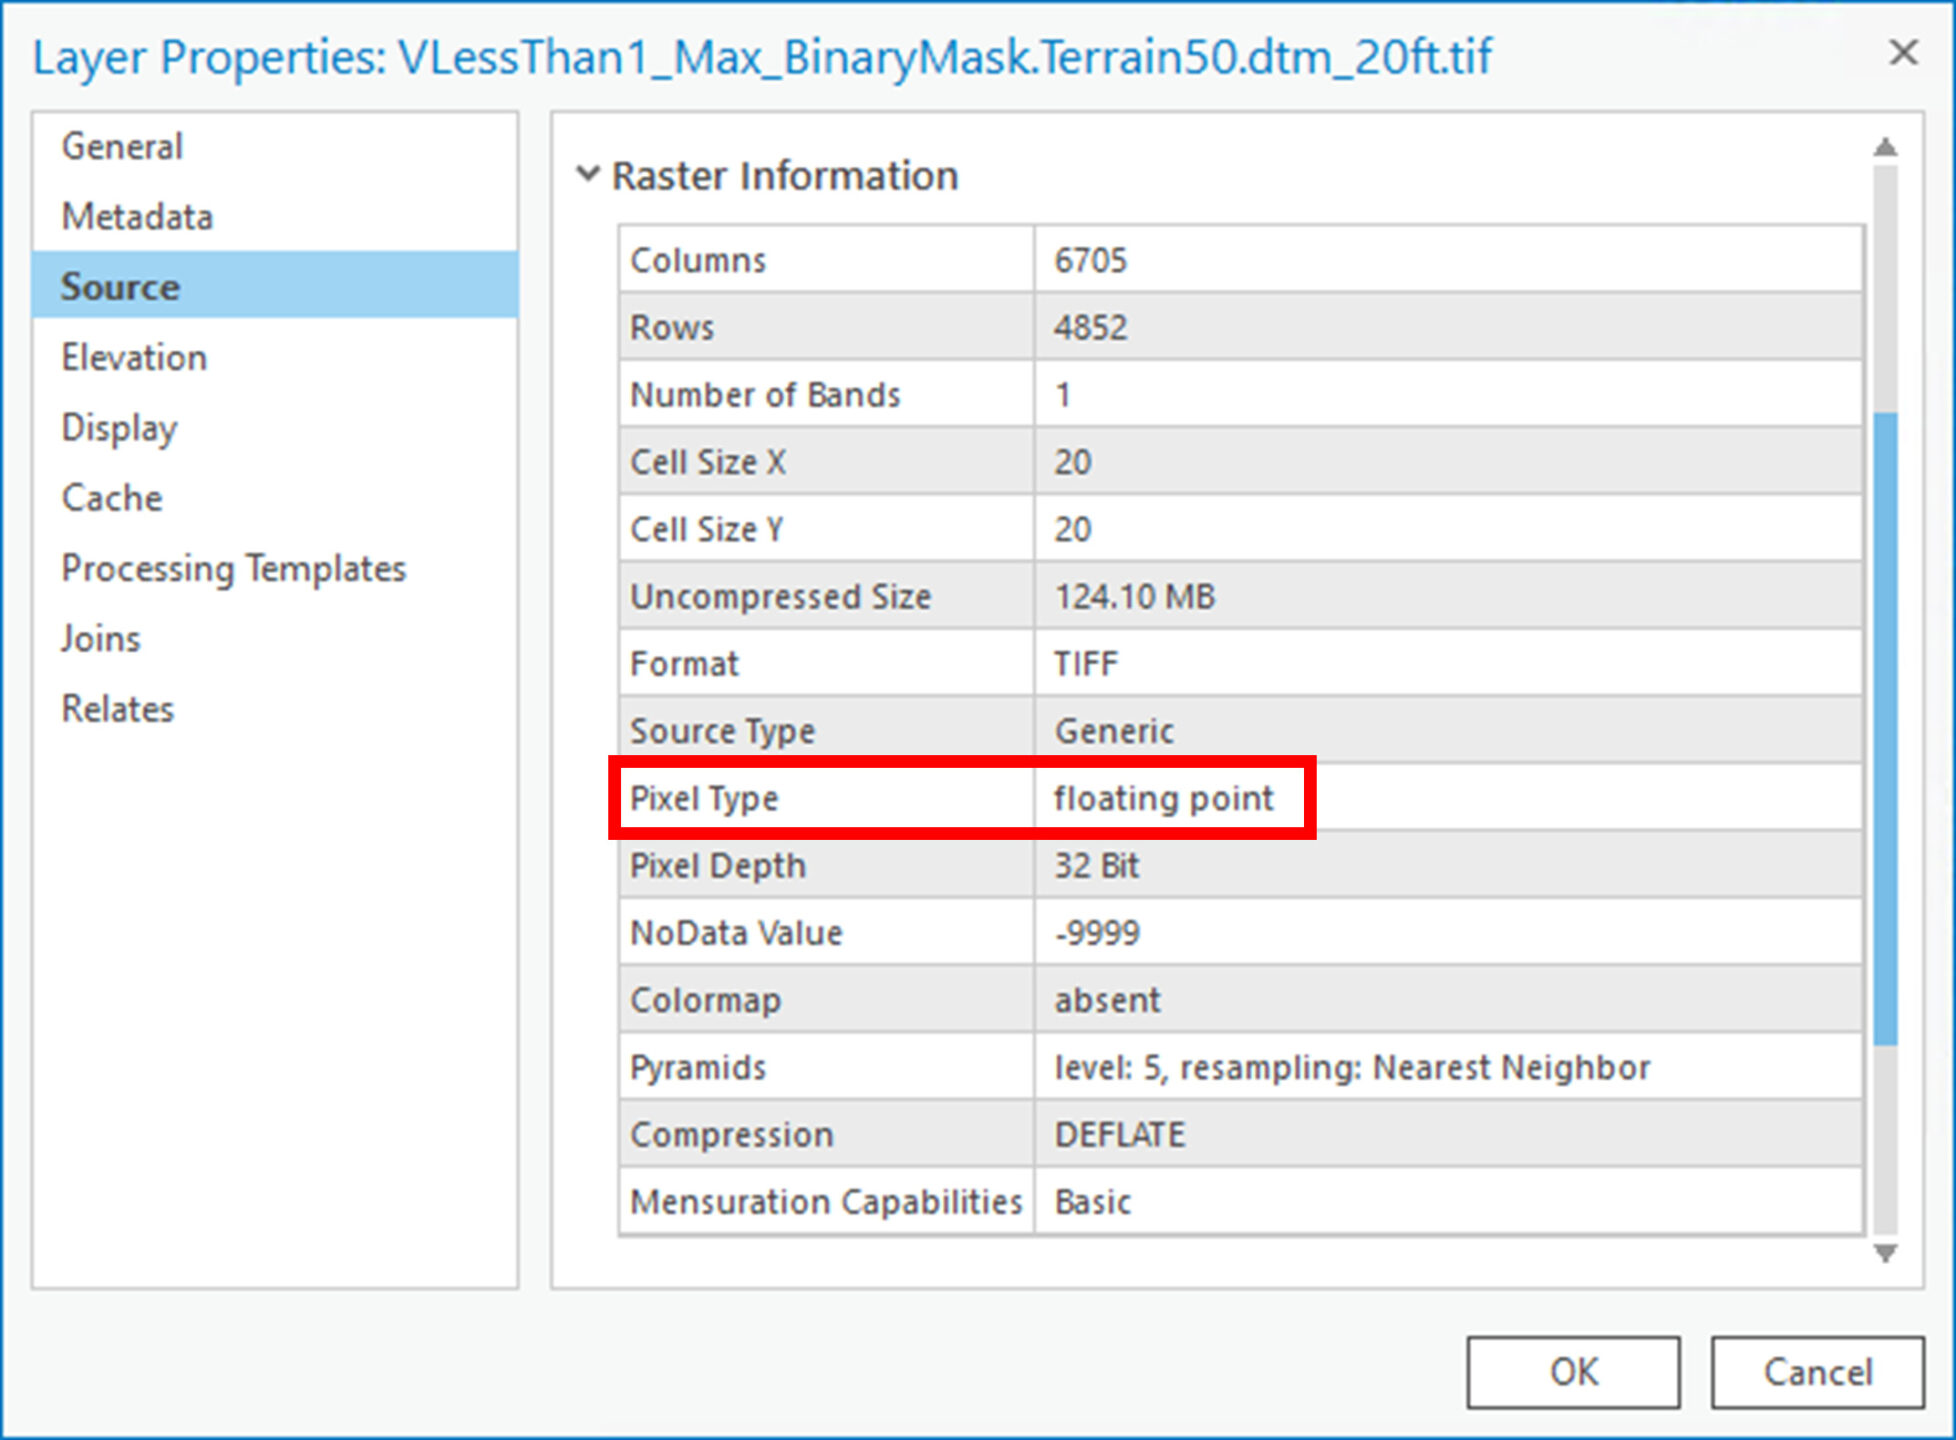
We will use the “Raster to Polygon” tool in ArcGIS Pro to convert the binary raster mask to a shapefile. Note, the “Raster to Polygon” tool requires an integer formatted raster. Previously, we specified a value of “1” to represent all areas where velocity never exceeded 1ft/s (binary True) and “NoData” elsewhere (binary False). The binary raster mask values of “1” are stored in floating point format by default in the HEC-RAS raster export. Floating point format means that there are one to six trailing zeroes in the decimal place, for example “1.000000”.
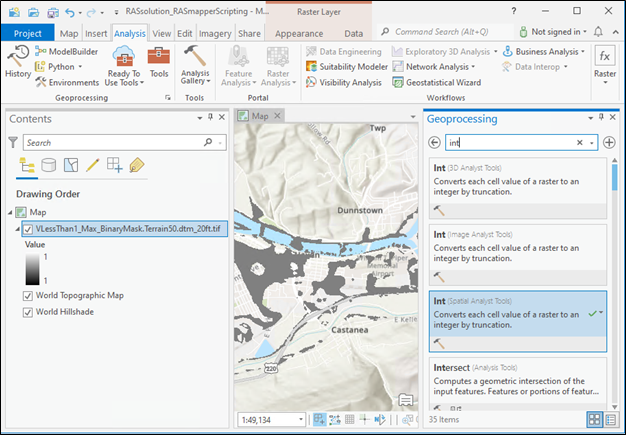
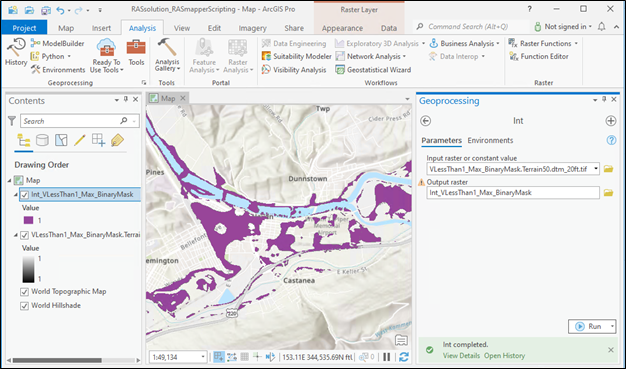
Use the ArcGIS Pro “Int” tool to convert the binary mask raster values to integer format. The “Int” tool requires a 3D Analyst, Image Analyst, or Spatial Analyst license.
Finally, convert the integer binary mask raster to a shapefile using the “Raster to Polygon” tool in Conversion Tools.
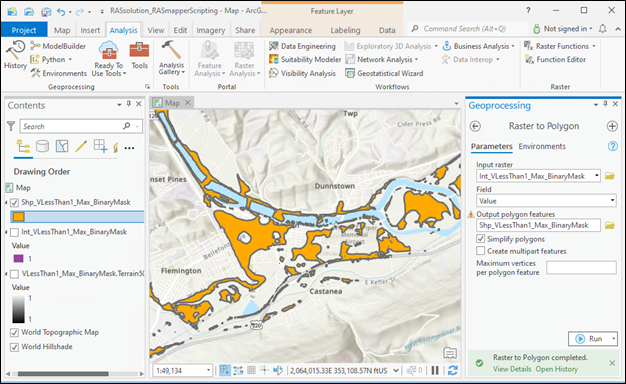
The result is a shapefile of all areas that never exceed a 1 ft/s velocity for all time steps in the simulation.
For the final example, we’ll be answering the question “Where do the plans’ maximum inundation extents agree and/or disagree?”. Comparing inundation extents means that we want a discrete value Calculated Layer. This is unlike the RASter Calculator’s default script “Compare WSE”. The “Compare WSE” tool creates a continuous value Calculated Layer via the subtraction operation. The “Compare WSE” tool works well where both plans show inundation, however, the tool fails where one plan is inundated and the other is not.
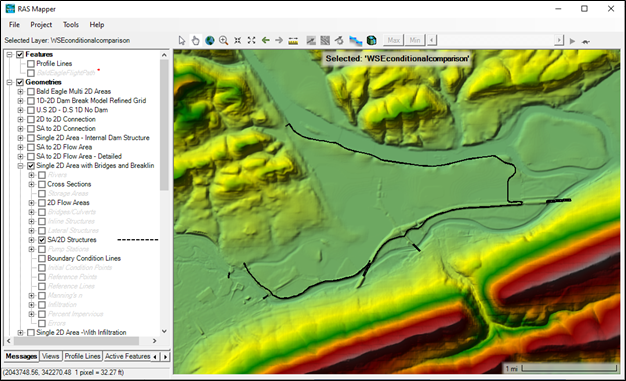
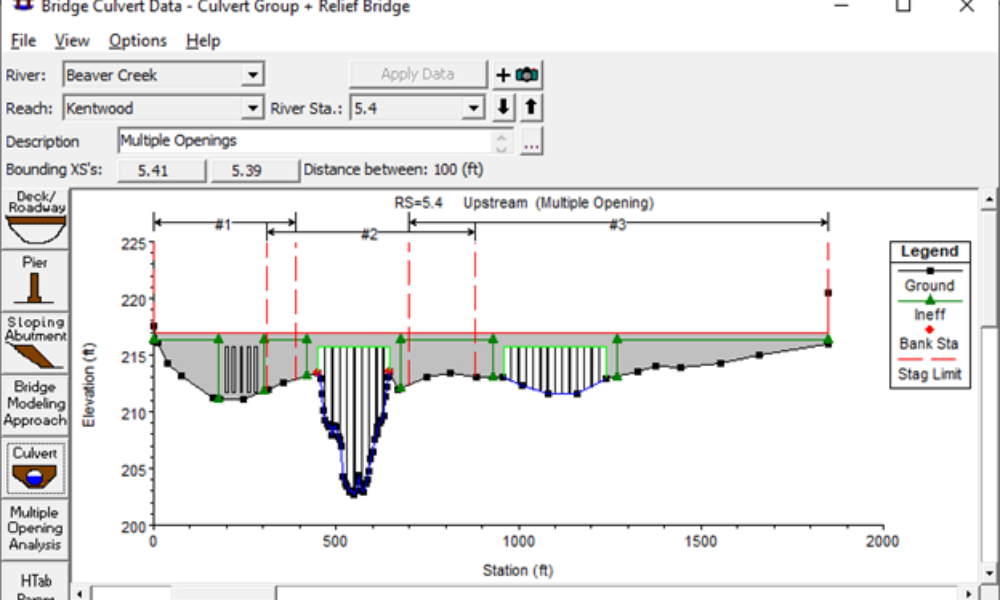
The two plans we are comparing in this example are both dam breach scenarios in the same study area. The levees surrounding the town of Flemington are simulated using SA/2D Structures (shown as black lines). The SA-2D Det FEQ plan includes two levee breaches. The levees are not breached in the Single 2D Bridges FEQ plan.
Comparing inundation extents is a useful tool when comparing several plans with significant differences. We can compare the inundation extents using the following standard confusion matrix.
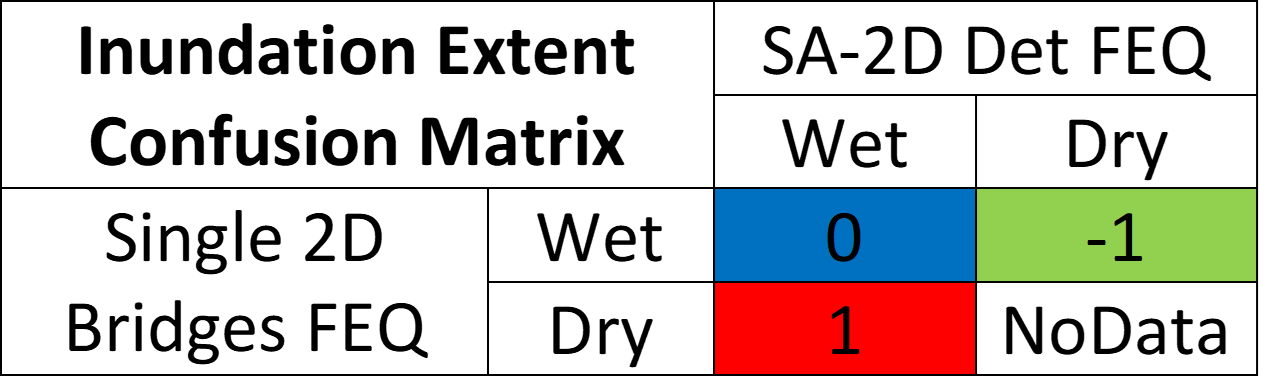
Areas where both plans show inundation will be represented by the value 0 and blue color. NoData and no color will represent areas where neither plan simulates inundation. Red and a value of 1 represents areas where the levee breach plan showed inundation and the levee intact plan was dry. Green and a value of -1 shows where the levee breach plan showed no inundation and the levee intact plan simulated wet cells.
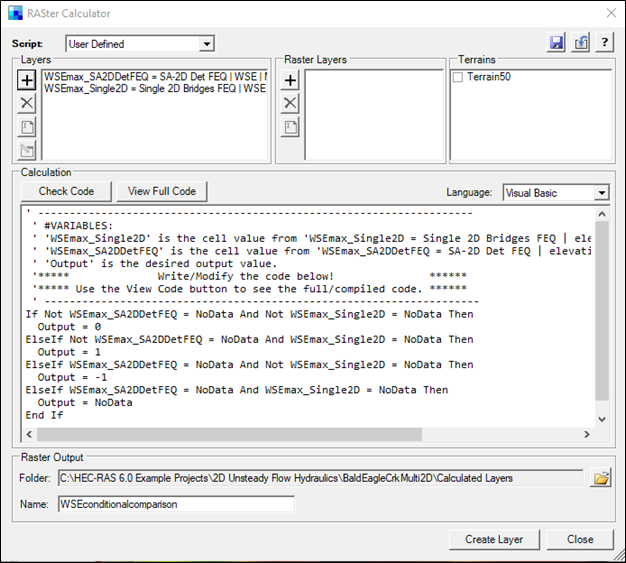
First, load the water surface elevation (WSE) maximum layers from each plan into the RASter Caculator using the static animation behavior. Then, create your script using conditional statements that represent the confusion matrix. The example operations and script are shown below.
If Not WSEmax_SA2DDetFEQ = NoData And Not WSEmax_Single2D = NoData Then

  Output = 0

ElseIf Not WSEmax_SA2DDetFEQ = NoData And WSEmax_Single2D = NoData Then

  Output = 1

ElseIf WSEmax_SA2DDetFEQ = NoData And Not WSEmax_Single2D = NoData Then

  Output = -1

ElseIf WSEmax_SA2DDetFEQ = NoData And WSEmax_Single2D = NoData Then

  Output = NoData

End If
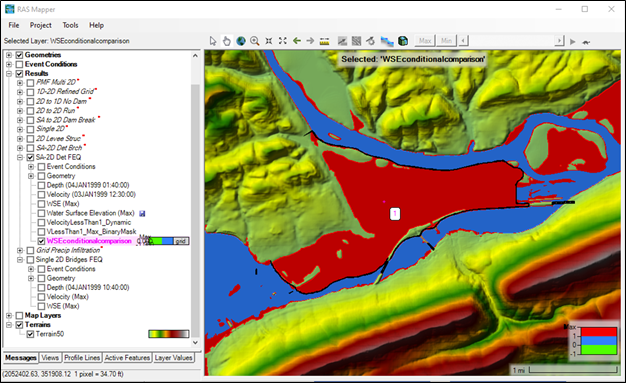
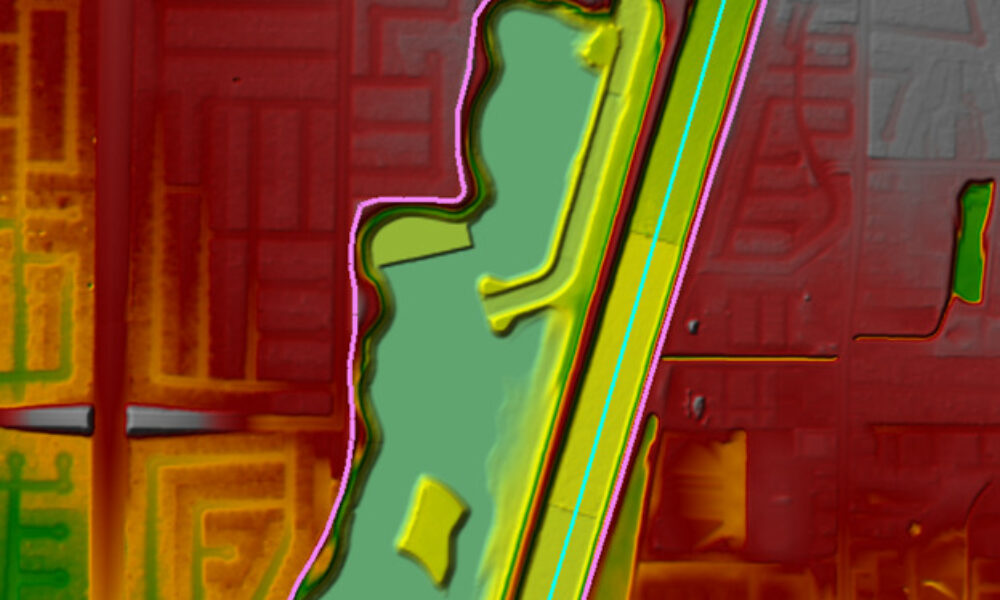
The ramp values in RAS Mapper can be changed to discrete and edited to match the colors in the confusion matrix. As expected, the breached levee plan simulated inundation behind the levees whereas the intact levee plan did not. The blue areas indicate where both plans simulated inundation, mostly in the river and along the unprotected floodplain. The simple color blocking and easy to understand conditional statements help to highlight plan differences. This inundation extent comparison can also be scripted as a Dynamic evaluation.
The RASter Calculator allows users to create simple or complex scripts to analyze RAS results. As shown, user-defined scripts can be used to analyze both dynamic and static results as well as compute comparisons between plans. Users are encouraged to make generalized scripts so that functions can be shared and implemented across a variety of different projects. Consider using RASter Calculator scripting for your next project!

Comments
Jeanne McFall
on October 13, 2021This is perfect!! Thanks for such a great thoughtful explanation. Figuring out the script writing and analysis was tricky but this nails it. You guys rock.
ali
on December 17, 2021Hello. Thanks for the services you provide.
I have two clay files that simulate floods from two different basins. I want to import these two files together
And get an output file is this possible
Hugh N
on February 6, 2022HI Robert:
Just tried your code and one error prevent running.
Dim Output As Single = NoData
Do you have any suggestion?
Thanks
Hugh N
on February 6, 2022Just figured out, I selected a terrain
Lindsay
on May 13, 2022Hi, I’m trying to add my ‘Inundation Boundary’ so i can export to autocad. i can click ‘Add New Map’ in the ‘Manage Results Maps’ tab, and select ‘Inundation Boundary’ and add the map, but when i click on it and hit ‘Compute/Update Stored Maps’ i get an unhandled exception error that says ‘sequence contains no elements’. Do you have any idea how i can fix this? i’ve rerun all my steps multiple times, and uninstalled and reinstalled hec-ras.
Thanks!
Add Your Comment