
February 20, 2025
Full Momentum Episode 37: All Things Gates
Gates play a crucial role in hydraulic modeling, impacting water flow, flood control, and dam operations.
Question:
When running an unsteady flow model with a single inflow hydrograph, why does my discharge decrease in the downstream direction for a given output profile?
Answer:
This is called flow attenuation. You see this to varying degrees in all unsteady flow models and it is a real phenomenon. The shallower the reach, or the wider the floodplain, the more pronounced this effect will be. In very steep streams, you may not notice flow attenuation at all.
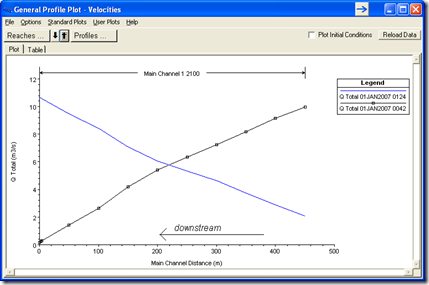
The physical process is as follows: As the flood level rises, water moving downstream fills in available volume. This volume is called storage. Water going into storage is taken away from the flow going downstream and that is why you see a decrease in discharge as you move in the downstream direction. Wider floodplains and shallower reaches have more available storage volume, which is why flow attenuation is pronounced under these situations. Once the flood wave passes, and you are on the receding limb of the flood hydrograph, the water that had gone into storage now returns to the active discharge. In this case you’ll see an increase in flow as you move in the downstream direction. Notice in the figure below that the discharge at time 0042 (before the peak of the flood wave) decreases in the downstream direction, while the flow at time 0124 (after the peak of the flood wave) increases in the downstream direction.


Attenuation is included in the conservation of mass equation, which is one of the two equations (the St. Venant equations) used to define the movement of water through a reach in HEC-RAS-the other being conservation of momentum. From the HEC-RAS Hydraulic Reference Manual (Page 2-22), “Conservation of mass for a control volume states that the net rate of flow into the volume be equal to the rate of change of storage inside the volume.” In other words, Inflow minus outflow equals the change in storage over time. The equation is:
![]()
where A = flow area, Q equals discharge, t = time, and x = length.
The discretized form of this is more practical to use and may be more familiar:
![]()
Where I = Inflow to a discrete control volume, O = Outflow, DS = Change in Storage, Dt = time duration (i.e. time step).
Comments
Adam
on February 18, 2016Is there a recommended method for intentionally increasing attenuation? Our model shows some attenuation downstream, but not enough based on our gaged data near the downstream boundary condition.
Chris Goodell
on February 18, 2016Increasing the n values is the easy thing to do to increase attenuation. Also, if you are not properly accounting for all available storage (both in cross sections with ineffective flow areas and offline with storage areas), you'll underestimate attenuation. Look for portions of cross sections that should be ineffective. Also, look for cross sections where the water surface extends above the end points at any time during the simulation. That is a sure way to underestimate storage.
Anonymous
on July 7, 2016I am doing a dymamic routing of a reservoir and I would like to know how I can measure de volume of the reservoir for different levels of the reservoir.
Should I use the steady analysis or the volume of a reservoir can be obtained also using unsteady analysis.
Thanks,
Chris Goodell
on July 7, 2016In the standard table 1 output, you can add the variable "cum volume". That is the best way to measure the volume in the reservoir. Just subtract the cumulative volume at the upstream end of the reservoir from the cumulative volume at the downstream end. If you do this from a dynamic routing run, you'll get the "dynamic" volume for a given stage. If you want a static (or level pool) volume for a given stage, set up a bunch of steady flow profiles and run those.
Angana Borah
on June 4, 2018I am getting the same results by using breaklines and not using breaklines for a only 2d analysis. Can anyone tell me why? i have followed the standard procedure. Thanks in advance.
James
on June 19, 2020Hi Chris,
Are you able to explain what you meant by ‘cross sections where the water surface extends above the end points’ in the second comment? I’m new to HEC-RAS so don’t understand the term ‘end points’.
Many thanks,
James
Chris Goodell
on June 19, 2020The end points are the first and last station-elevation points of a cross section.
Danny Lee
on July 15, 2021Hi Chris,
Is there any way to avoid or minimize the flow attenuation? my model has 70% of flow attenuation because it is flat area so the floodplain becomes wider.
Thanks,
Chris Goodell
on July 15, 2021Things that will reduce the amount of flow attenuation:
1. lower Manning’s n values
2. Less available storage.
3. Less ineffective flow areas (for 1D).
4. More efficient bridge, culvert, and weir coefficients.
Fuad
on July 13, 2022Has anyone seen the opposite? Peak flows increasing in the downstream direction? We have that situation near the downstream boundary of a model. The boundary condition is a stage hydrograph with constant water level (discharge to a major lake). The model does show attenuation in that last reach, which is governed by lake levels, if we lower the stipulated downstream level below the natural values; but the peak flow increases when impossing the real lake levels.
Chris Goodell
on August 12, 2022That would not be attenuation. It will happen if you have lateral flow inputs along the way. It can also happen when you have errors and instabilities in your model.
Add Your Comment